R语言提升专题
专题1:玩转字符串
stringr包
将一个字符串拆分至以字符为最小单位进行操作
str_length()检测字符串长度
library(stringr)
x <- "The birch canoe slid on the smooth planks."
x
## [1] "The birch canoe slid on the smooth planks."
str_length(x)
## [1] 42
length(x)
## [1] 1
str_split()分割字符串
str_split(x," ")
## [[1]]
## [1] "The"     "birch"   "canoe"   "slid"    "on"      "the"
## [7] "smooth"  "planks."
- 输出格式是列表
class(str_split(x," "))
## [1] "list"
- 将列表取子集,即是拆分结果组成的向量
x2 = str_split(x," ")[[1]];x2
## [1] "The"     "birch"   "canoe"   "slid"    "on"      "the"
## [7] "smooth"  "planks."
- 将多个字符串拆分,每个字符串拆分结果为一个列表元素
y = c("jimmy 150","nicker 140","tony 152")
str_split(y," ")
## [[1]]
## [1] "jimmy" "150"
##
## [[2]]
## [1] "nicker" "140"
##
## [[3]]
## [1] "tony" "152"
- 加入
simplify = T参数,输出结果简化为矩阵
str_split(y," ",simplify = T)
##      [,1]     [,2]
## [1,] "jimmy"  "150"
## [2,] "nicker" "140"
## [3,] "tony"   "152"
str_sub()按位置提取字符串
空格也算
str_sub(x,5,9)
## [1] "birch"
str_detect()检测字符串
生成与元素数量一致的逻辑值,可用于取子集
#检测向量中有‘h’的元素
str_detect(x2,"h")
## [1]  TRUE  TRUE FALSE FALSE FALSE  TRUE  TRUE FALSE
#检测向量中以‘T’开头的元素
str_starts(x2,"T")
## [1]  TRUE FALSE FALSE FALSE FALSE FALSE FALSE FALSE
#检测向量中以‘e’结尾的元素
str_ends(x2,"e")
## [1]  TRUE FALSE  TRUE FALSE FALSE  TRUE FALSE FALSE
str_replace()字符串替换
x2
## [1] "The"     "birch"   "canoe"   "slid"    "on"      "the"
## [7] "smooth"  "planks."
str_replace(x2,"o","A")
## [1] "The"     "birch"   "canAe"   "slid"    "An"      "the"
## [7] "smAoth"  "planks."
str_replace_all(x2,"o","A")
## [1] "The"     "birch"   "canAe"   "slid"    "An"      "the"
## [7] "smAAth"  "planks."
str_replace(x2,"o|e","A")
##[1] "ThA"     "birch"   "canAe"   "slid"    "An"      "thA"
##[7] "smAoth"  "planks."
str_remove()字符删除
x
## [1] "The birch canoe slid on the smooth planks."

str_remove(x," ")
## [1] "Thebirch canoe slid on the smooth planks."

str_remove_all(x," ")
## [1] "Thebirchcanoeslidonthesmoothplanks."
专题2:玩转数据框
arrange()排序
library(dplyr)
arrange(test, Sepal.Length) #从小到大
##   Sepal.Length Sepal.Width Petal.Length Petal.Width    Species
## 1          4.9         3.0          1.4         0.2     setosa
## 2          5.1         3.5          1.4         0.2     setosa
## 3          5.8         2.7          5.1         1.9  virginica
## 4          6.3         3.3          6.0         2.5  virginica
## 5          6.4         3.2          4.5         1.5 versicolor
## 6          7.0         3.2          4.7         1.4 versicolor
arrange(test, desc(Sepal.Length)) #从大到小
##   Sepal.Length Sepal.Width Petal.Length Petal.Width    Species
## 1          7.0         3.2          4.7         1.4 versicolor
## 2          6.4         3.2          4.5         1.5 versicolor
## 3          6.3         3.3          6.0         2.5  virginica
## 4          5.8         2.7          5.1         1.9  virginica
## 5          5.1         3.5          1.4         0.2     setosa
## 6          4.9         3.0          1.4         0.2     setosa
distinct()去重复
.keep_all =T这一参数保证表格完整性
distinct(test,Species,.keep_all = T)
##   Sepal.Length Sepal.Width Petal.Length Petal.Width    Species
## 1          5.1         3.5          1.4         0.2     setosa
## 2          7.0         3.2          4.7         1.4 versicolor
## 3          6.3         3.3          6.0         2.5  virginica
*select()、filter()挑选列、行
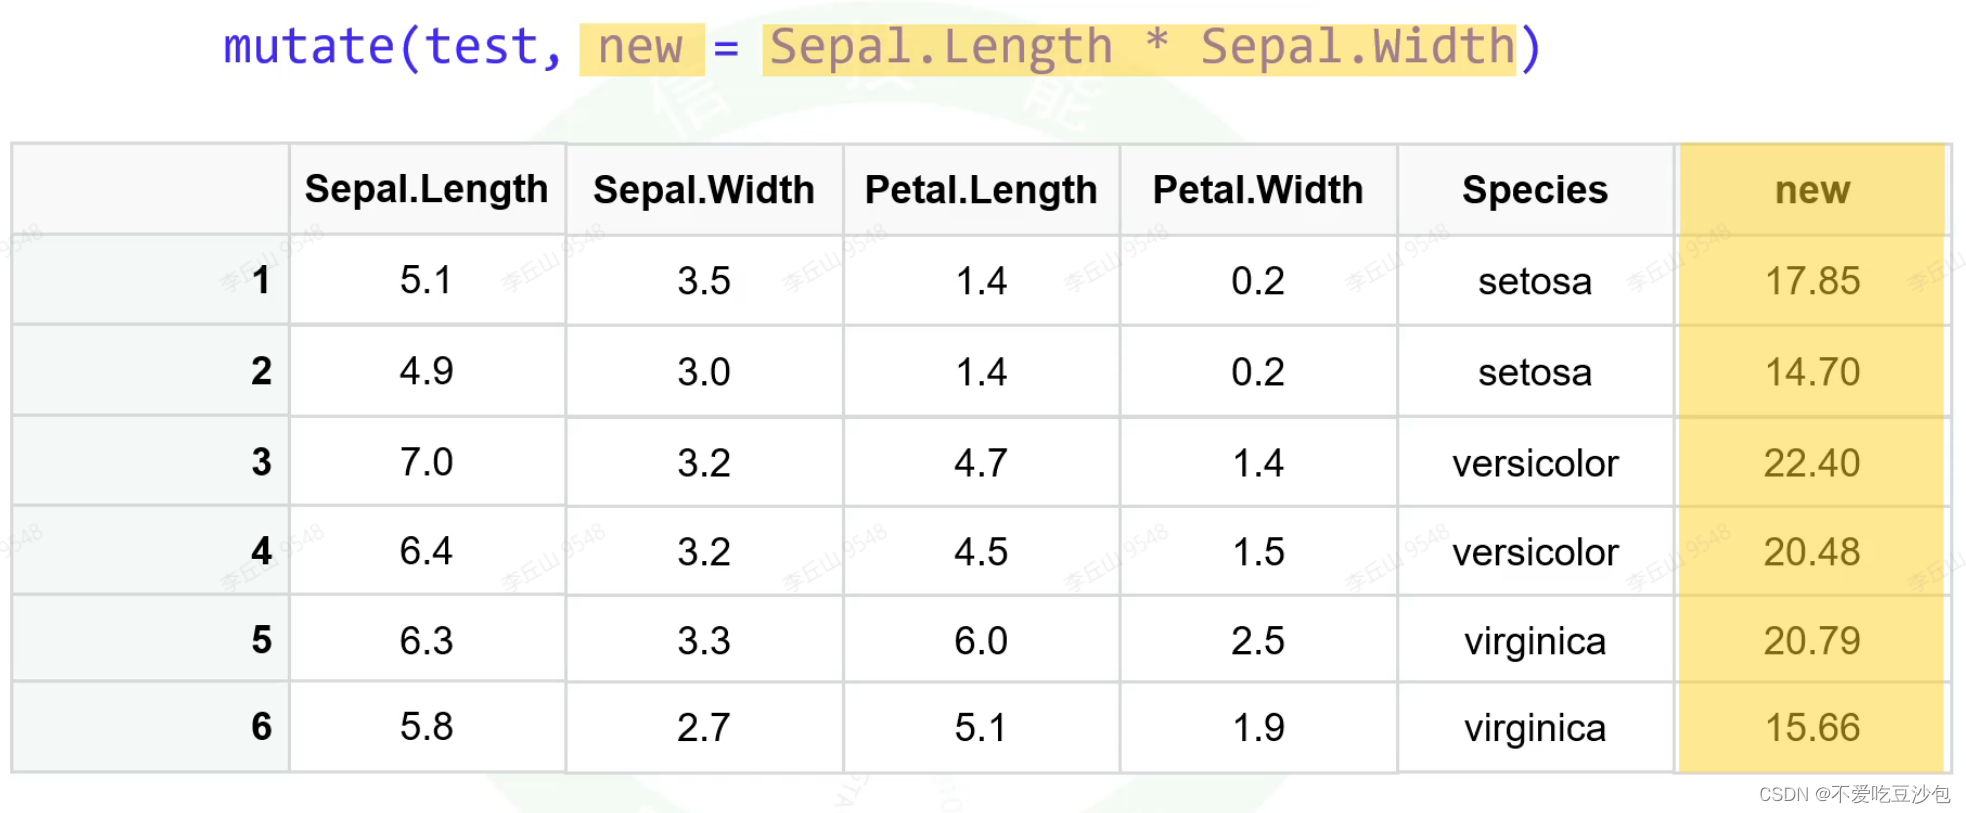
mutate()数据框新增列
%>%管道符号
用于连续步骤时使用,避免产生很多中间变量,又避免了嵌套代码不易读的问题
快捷键Ctrl+Shift+m
#中间变量
x1 = select(iris,-5)
x2 = as.matrix(x1)
x3 = head(x2,50)
pheatmap::pheatmap(x3)
#嵌套
pheatmap::pheatmap(head(as.matrix(select(iris,-5)),50))
#管道符号:把前一行的结果变量传至下一个函数的第一个参数
iris %>%
  select(-5) %>%
  as.matrix() %>%
  head(50) %>%
  pheatmap::pheatmap()
专题3:条件和循环
if条件语句
-
只有if,没有else
if(T/F){
    <CODE>
}

#eg:
if(!require(tidyr)) install.packages('tidyr')
()中代表一个逻辑值,如为T则运行{}中代码,如为F,则不运行。
- 长脚本管理方式
- 打包封装:
if(F){...}则跳过,if(T){...}则运行,带有{}的代码可以被折叠。 - 分成多个脚本,每个脚本保存RData,下个脚本开头清空再加载数据。
- 打包封装:
-
if…else…
if(T/F){
    <CODE1>
}else{
    <CODE2>
}
如果
()中为T,执行CODE1,如果()中为F,执行CODE2。 -
ifelse()只有三个参数:
x逻辑值/逻辑值向量;yes逻辑值为T时的返回值;no逻辑值为F时的返回值。支持单个逻辑值,也支持逻辑值向量。
x
##[1]  0.6582069 -0.3887199  0.1477327
ifelse(x>0,"+","-")
##[1] "+" "-" "+"
-
和
str_detect()组合samples = c("tumor1","tumor2","tumor3","normal1","normal2","normal3") k1 = str_detect(samples,"tumor");k1 ##[1] TRUE TRUE TRUE FALSE FALSE FALSE ifelse(k1,"tumor","normal") ##[1] "tumor" "tumor" "tumor" "normal" "normal" "normal"
-
多个条件嵌套
i=0
if (i>0){
  print('+')
} else if (i==0) {
  print('0')
} else if (i< 0){
  print('-')
}
##[1] "0"

ifelse(i>0,"+",ifelse(i<0,"-","0"))
##[1] "0"

library(dplyr)
case_when(i>0 ~ '+',
          i<0 ~ '-',
          TRUE ~ '0'
)
For 循环
对x中的变量i进行循环
for (i in x){
    <CODE>
}
for( i in 1:4){
  print(i)
}
##[1] 1
##[1] 2
##[1] 3
##[1] 4
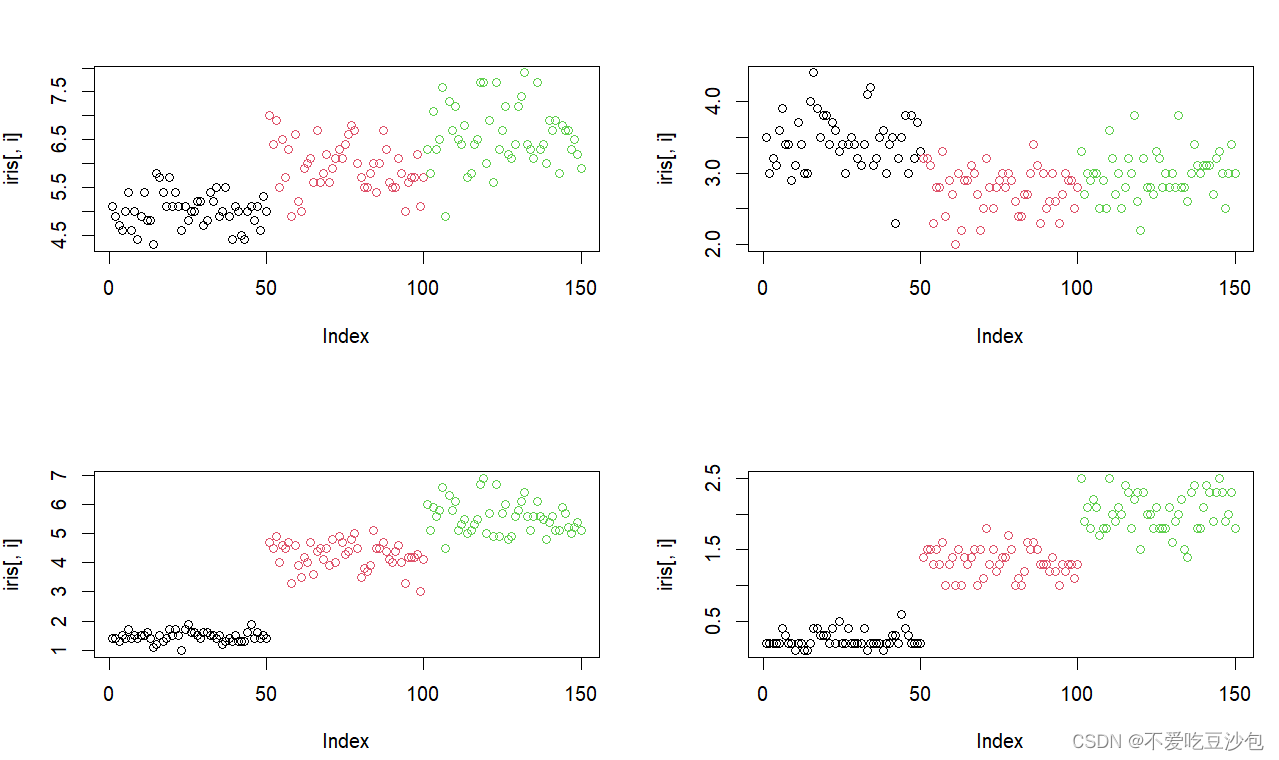
- 批量画图
par(mfrow = c(2,2))      ##用于基础包的拼图函数
for(i in 1:4){
  plot(iris[,i],col = iris[,5])
}
- 批量装包
pks = c("tidyr","dplyr","stringr")
for(g in pks){
  if(!require(g,character.only = T))
    install.packages(g,ask = F,update = F)
}
专题4:隐式循环
apply矩阵/数据框的隐式循环
apply(X,MARGIN,FUN,...)
三个函数:
-
x:数据框/矩阵;
-
MARGIN:1为行,2为列;
-
FUN:对行/列所作的操作。
test<- iris[1:6,1:4]
apply(test, 2, mean)
## Sepal.Length  Sepal.Width Petal.Length
##    4.9500000    3.3833333    1.4500000
## Petal.Width
##    0.2333333
apply(test, 1, sum)
返回值是向量,列名/行名是向量元素的名字
lapply向量/列表的隐式循环
lapply(list,FUN,...)
对列表/向量中的每个元素实施相同的操作
专题5:两个数据框的连接
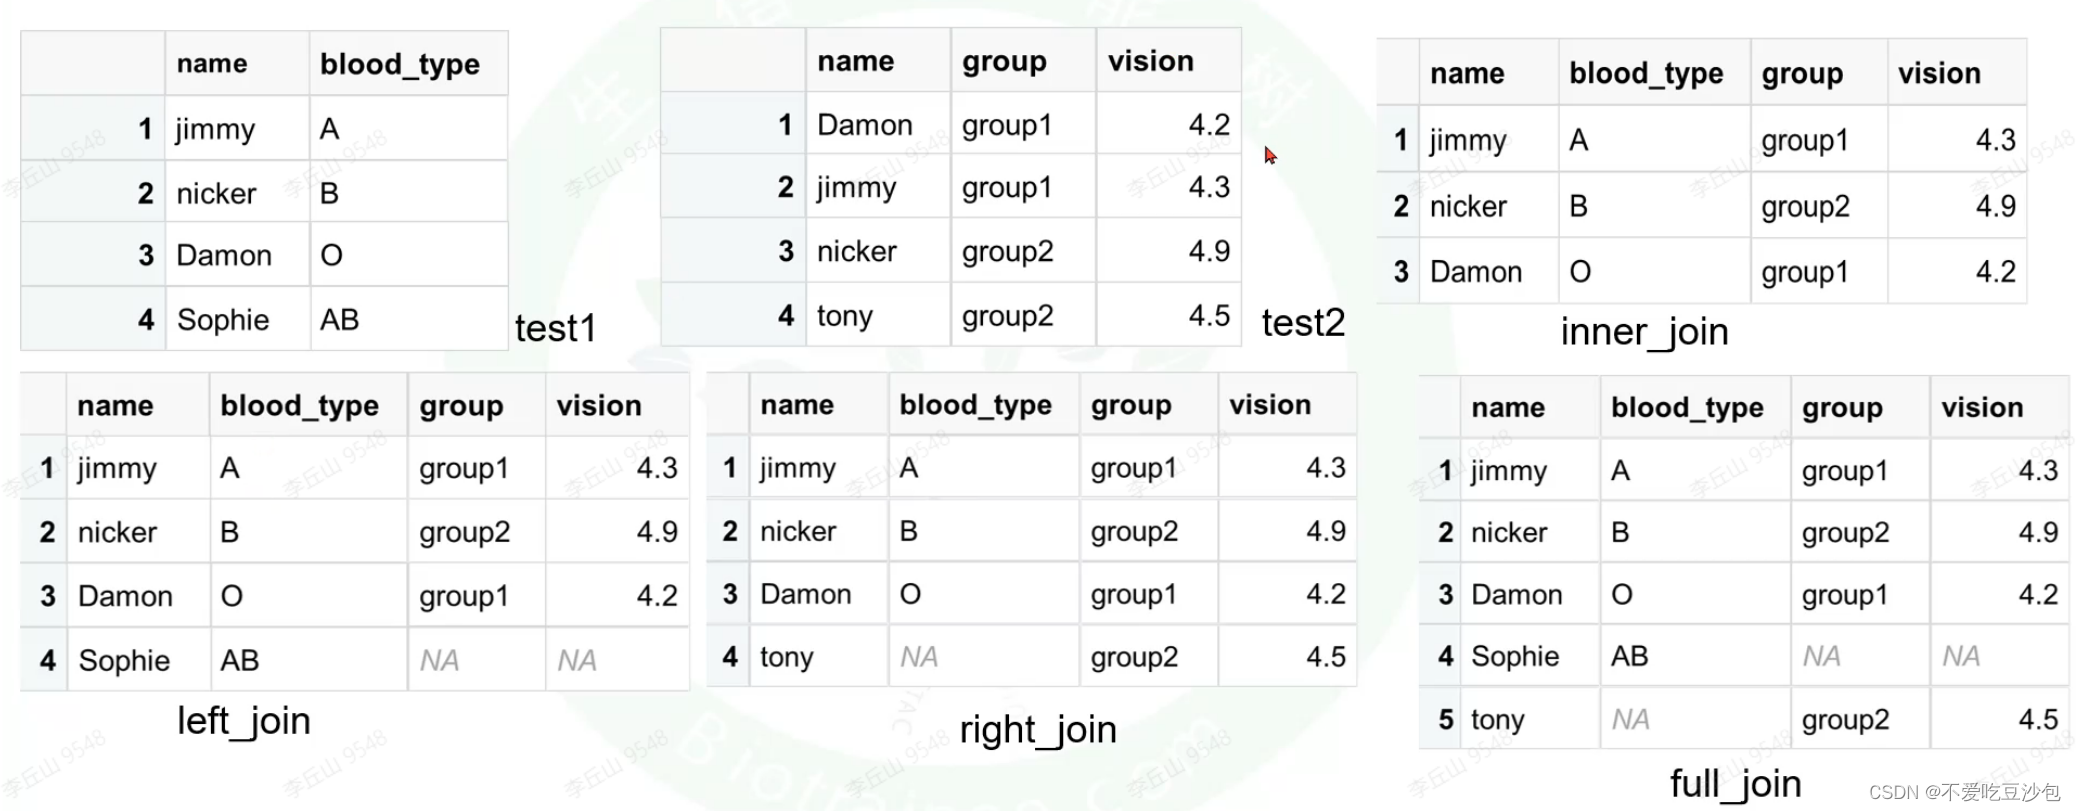
-
inner_join取交集 -
full_join全连接 -
left_join左连接 -
right_join右连接
FUNCTION(x, y, by='')
专题6:表达矩阵画箱线图
表达矩阵的格式不是ggplot2能够直接使用的格式,因此需要更改数据组织方式
- 转置数据框
- 把行名变成其中一列,避免行名丢失
- 把数据的参数变为列:行名、基因、表达量、分组(宽边长)
exp
##      test1 test2 test3 test4 test5 test6
##gene1  1.55  1.49  1.80 -0.37 -1.82 -1.62
##gene2 -1.74  0.37  2.08  2.11 -0.22  1.42
##gene3  1.57  1.25  1.32  2.49  0.58 -0.81
dat = t(exp) %>%
  as.data.frame() %>%
  rownames_to_column() %>%
  mutate(group = rep(c("control","treat"),each = 3))
dat
##   rowname gene1 gene2 gene3   group
## 1   test1  1.55 -1.74  1.57 control
## 2   test2  1.49  0.37  1.25 control
## 3   test3  1.80  2.08  1.32 control
## 4   test4 -0.37  2.11  2.49   treat
## 5   test5 -1.82 -0.22  0.58   treat
## 6   test6 -1.62  1.42 -0.81   treat
- 宽变长
pdat = dat%>%
  pivot_longer(cols = starts_with("gene"),
               names_to = "gene",
               values_to = "count")
pdat
### A tibble: 18 × 4
##    rowname group   gene  count
##    <chr>   <chr>   <chr> <dbl>
##  1 test1   control gene1  1.55
##  2 test1   control gene2 -1.74
##  3 test1   control gene3  1.57
##  4 test2   control gene1  1.49
##  5 test2   control gene2  0.37
##  6 test2   control gene3  1.25
##  7 test3   control gene1  1.8
##  8 test3   control gene2  2.08
##  9 test3   control gene3  1.32
## 10 test4   treat   gene1 -0.37
## 11 test4   treat   gene2  2.11
## 12 test4   treat   gene3  2.49
## 13 test5   treat   gene1 -1.82
## 14 test5   treat   gene2 -0.22
## 15 test5   treat   gene3  0.58
## 16 test6   treat   gene1 -1.62
## 17 test6   treat   gene2  1.42
## 18 test6   treat   gene3 -0.81
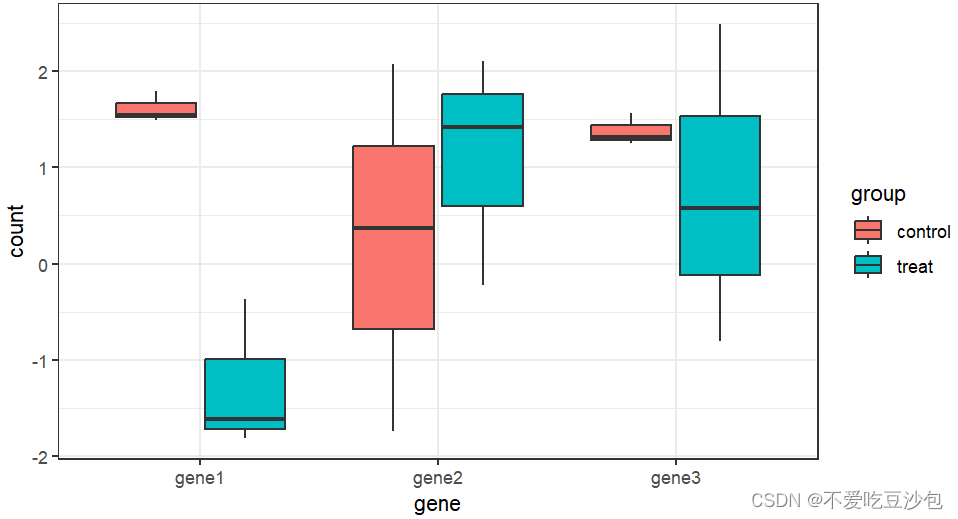
- 画图
library(ggplot2)
p = ggplot(pdat,aes(gene,count))+
  geom_boxplot(aes(fill = group))+
  theme_bw()
p
一些优秀函数!
先mark一下!以后再整理吧~
match()dir()file.create()file.exists()file.remove()
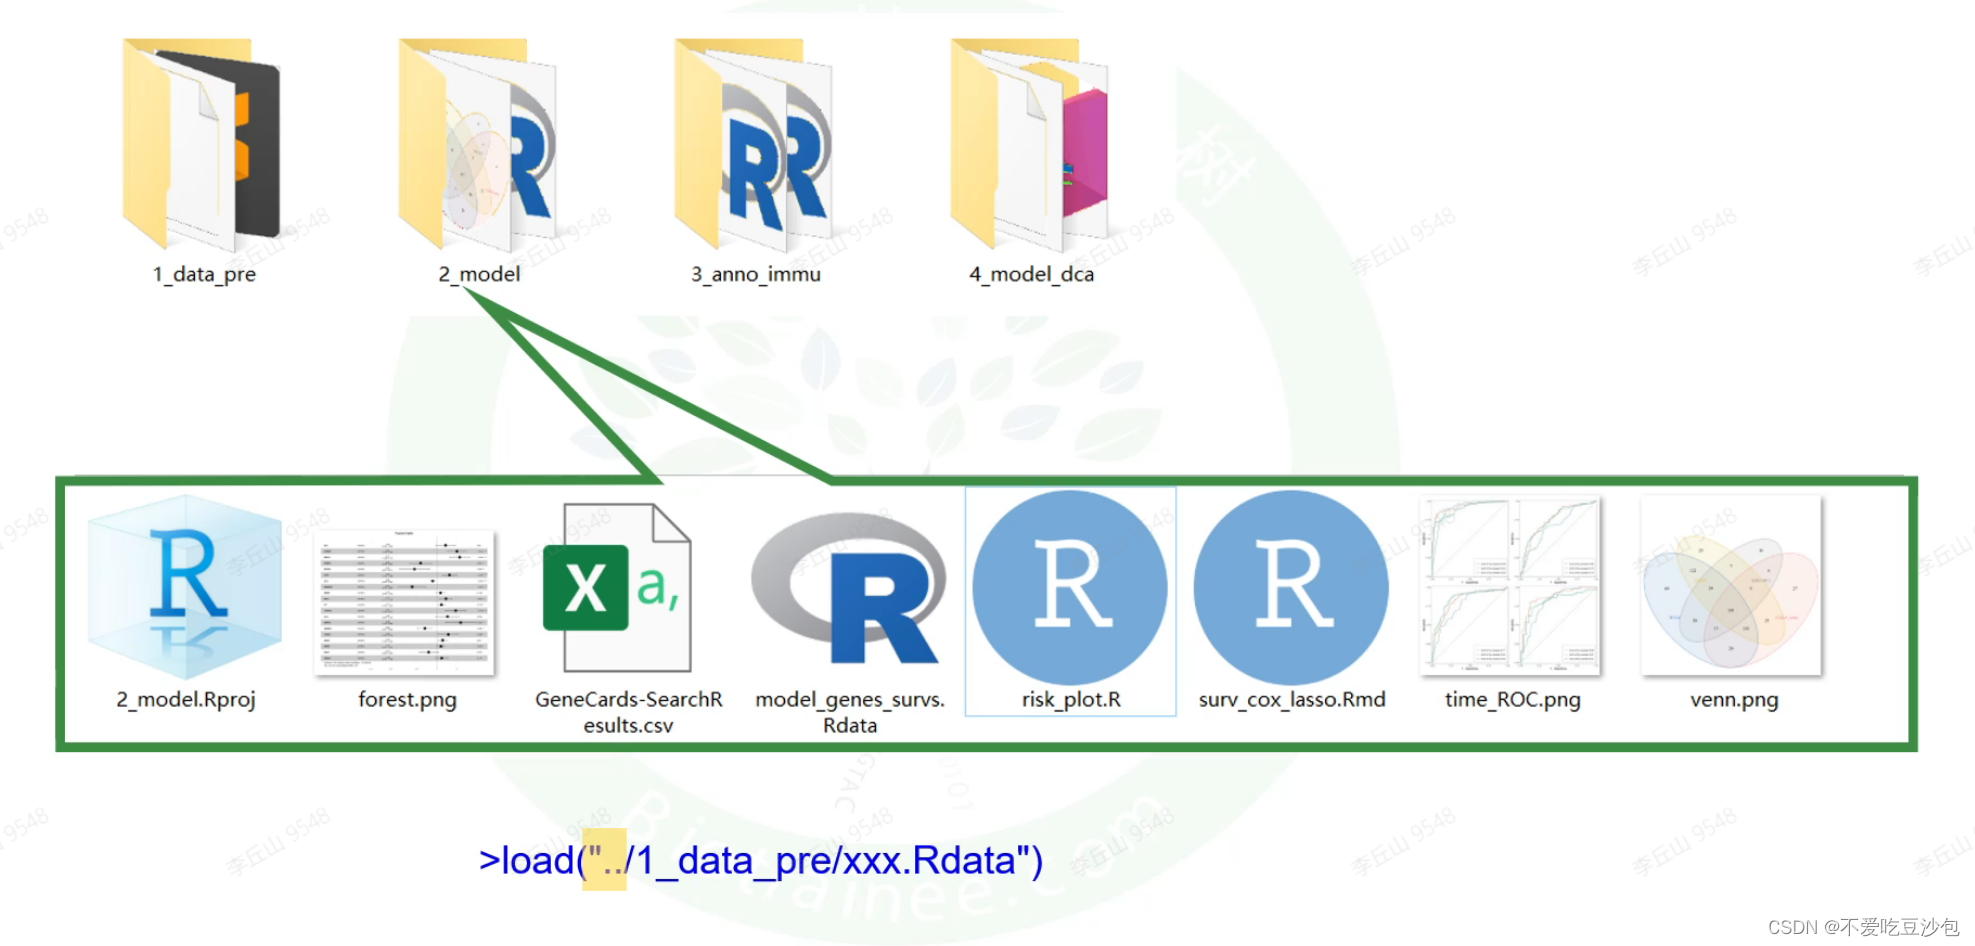
实战项目的组织方式
-
一个项目下建立输出文件、输入文件、图片、Rdata等文件夹分别管理

-
每个步骤使用一个文件夹进行管理,尽量不改变文件夹组织的位置


 592
592


 被折叠的 条评论
为什么被折叠?


