


一、三维柱状图bar3()
clear;clc;
figure(111)
% 读取数据
load("BostonTemp.mat");
yearIdx = 16;
%只绘制16:21行
TempData6Years = Temperatures(yearIdx:yearIdx+5,:);
% 颜色定义
map = addcolorplus(271);
b = bar3(TempData6Years,0.6);
hTitle = title(sprintf('Average Monthly Temperatures from %d to %d',Year(yearIdx),Year(yearIdx+5)));
hXLabel = xlabel('Month');
hYLabel = ylabel('Year');
hZLabel = zlabel('Temperature (\circF)');%\circ是Latex语句,右上小圈
% 赋色
for i = 1:length(b)
    zdata = b(i).ZData;
    b(i).CData = zdata;%x轴同为渐变色
    b(i).FaceColor = "interp";%填充
end
colormap(map);
set(gcf,'Color',[1 1 1]);
set(gca,'Box','off',...
    'LineWidth',1,'GridLineStyle','-',...
    'XGrid','off','YGrid','off','ZGrid','on',...
    'TickDir','out','TickLength',[0.015,0.015],...
    'XColor',[.1 .1 .1],'YColor',[.1 .1 .1],'ZColor',[.1 .1 .1],...
    'XTickLabel',Months,'YTickLabel',Year(yearIdx):Year(yearIdx+5));
set([hXLabel,hYLabel,hZLabel],'FontSize',12,'FontName','AvantGarde');
set(gca,'FontSize',10,'FontName','Helvetica');
set(hTitle,'FontSize',10,'FontWeight','bold');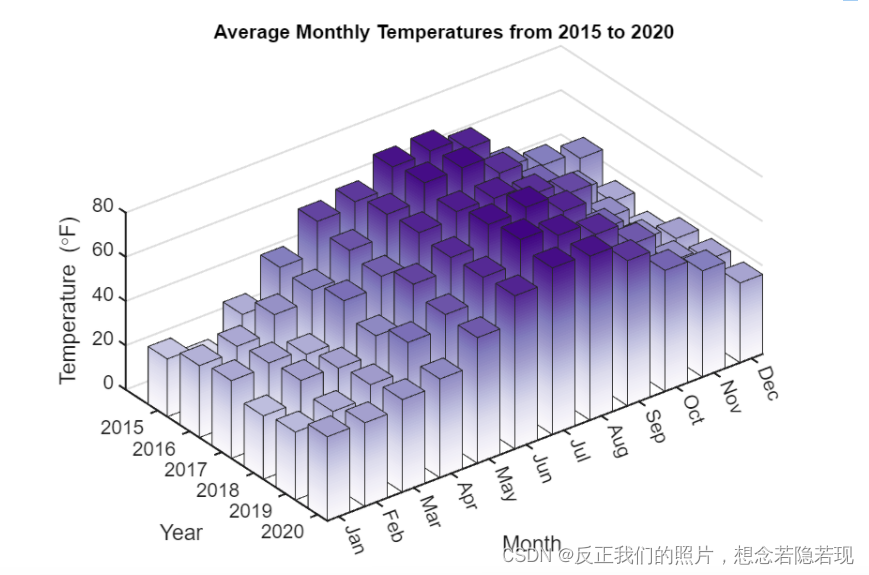
二、等高线图contourf()
clear;clc;
figure(2);
%加载数据
load mountain2.mat;
[X,Y] = meshgrid(xi,yi);%X,Y都是yi×xi规格的矩阵
Z = DSM;%Z为yi×xi规格
% 颜色定义
map = addcolorplus(272);
%图片尺寸设计
figureUnits = 'centimeters';
figureWidth = 16; % 宽度
figureHeight = 10; % 高度
set(gcf,'Units',figureUnits,'Position',[0,0,figureWidth,figureHeight]);
hh = contourf(X,Y,Z,10,'LineWidth',1.5); %10表示层级为10
hTitle = title('Contourf Plot');
hXLabel = xlabel('XAxis');
hYLabel = ylabel('YAxis');
% 赋色
colormap(map) %新颜色方案的颜色图
colorbar %显示色阶条
% 背景颜色
set(gcf,'Color',[1 1 1]);
% 坐标轴美化
axis equal %x轴和y轴以0对称
set(gca,'Box','off',... %关闭边框
    'LineWidth',1.2,... %线宽
    'TickDir','out','TickLength',[.015,.015],... %刻度
    'XMinorTick','on','YMinorTick','on',... %小刻度
    'XColor',[.1 .1 .1],'YColor',[.1 .1 .1]); %坐标轴颜色
hold on
xl = get(gca,'xlim');xr = xl(2); %x轴右边
yl = get(gca,'ylim');yt = yl(2); %y轴上边
xc = get(gca,'XColor');yc = get(gca,'XColor');
plot(xl,yt*ones(size(xl)),'Color',xc,'LineWidth',1);
plot(xr*ones(size(yl)),yl,'color', yc,'LineWidth',1);
set(gca,'FontName','Helvetica','FontSize',10);
set([hXLabel,hYLabel],'FontName','AvantGarde','FontSize',11)
set(hTitle,"FontSize",11,"FontWeight",'bold');
hold off;
三、热图heatmap()
clear;clc;
figure(3);
% 读取数据
cdata=[1.00    0.16    0.29    0.05    0.34    0.41    0.29    0.22    0.25    0.56
     0.16    1.00    0.44    0.29    0.13    0.12    0.19    0.01    0.26    0.07
     0.29    0.44    1.00    0.08    0.32    0.35    0.36    0.20    0.02    0.27
     0.05    0.29    0.08    1.00    0.21    0.20    0.26    0.24    0.20    0.06
     0.34    0.13    0.32    0.21    1.00    0.86    0.45    0.61    0.06    0.43
     0.41    0.12    0.35    0.20    0.86    1.00    0.54    0.65    0.17    0.54
     0.29    0.19    0.36    0.26    0.45    0.54    1.00    0.37    0.14    0.26
     0.22    0.01    0.20    0.24    0.61    0.65    0.37    1.00    0.03    0.30
     0.25    0.26    0.02    0.20    0.06    0.17    0.14    0.03    1.00    0.52
     0.56    0.07    0.27    0.06    0.43    0.54    0.26    0.30    0.52    1.00]; %可以有负数
% 颜色定义
map = addcolorplus(273);
% 图片尺寸设置(单位:厘米)
figureUnits = 'centimeters';
figureWidth = 12;
figureHeight = 11;
set(gcf, 'Units', figureUnits, 'Position', [0 0 figureWidth figureHeight]);
% 绘制热图
string_name = {'s1','s2','s3','s4','s5','s6','s7','s8','s9','s10'};
xvalues = string_name;
yvalues = string_name;
h = heatmap(xvalues,yvalues,cdata,'FontName','Helvetica','FontSize',8);
h.Title = 'Correlation Coefficient';
h.XLabel = 'XLabel';
h.YLabel = 'YLabel';
% h.CellLabelColor = "none" %不显示数字
% 背景颜色
set(gcf,'Color',[1 1 1]);
% 赋色
colormap(map);
相关文件下载链接:http://链接:https://pan.baidu.com/s/1ITM_AhIzDKcwRXKbwy7MQw?pwd=6doz 提取码:6doz


 1050
1050


 被折叠的 条评论
为什么被折叠?
被折叠的 条评论
为什么被折叠?
 到【灌水乐园】发言


