


🚀 Introduction to Data Flow Graphs (DFGs): 数据流图简介
Data Flow Graphs (DFGs) 是一种用于建模数据在一系列操作中流动的强大表示方法。在计算机科学中,它被广泛用于编译器设计、硬件设计以及性能优化等领域。尽管文献中讨论了 DFG 的不同版本,但它们共享一些关键的共同特性,使得它们在概念上既优雅又实用。
让我们一步步理解吧!🌟
💡 What is a Data Flow Graph (DFG)? 什么是数据流图 (DFG)?
Core Features of a DFG: 数据流图的核心特性
-
Directed Graph Representation: 有向图表示
- A DFG is a directed graph, where the nodes represent computational operations (or actors), and the arcs (edges) represent paths over which data flows.
DFG 是一种有向图,其中节点表示计算操作(或称为“执行者”),弧线(边)表示数据流动的路径。
- A DFG is a directed graph, where the nodes represent computational operations (or actors), and the arcs (edges) represent paths over which data flows.
-
Node Operations: 节点操作
- Dynamically, a node in a DFG "fires" (similar to a Petri net). It accepts one or more data items as inputs, performs a computation, and produces output data items.
动态地,DFG 中的节点通过“触发”(类似于 Petri 网)来执行操作。它接受一个或多个数据项作为输入,完成计算后生成输出数据项。
- Dynamically, a node in a DFG "fires" (similar to a Petri net). It accepts one or more data items as inputs, performs a computation, and produces output data items.
-
Trigger Mechanism: 触发机制
- The action of a node is triggered by the presence of input data.
节点的操作由输入数据的到达触发。
- The action of a node is triggered by the presence of input data.
📚 Models of Data Flow Graphs 数据流图的模型
The study of DFGs focuses on three well-defined formal models:
数据流图的研究主要集中在三种明确定义的形式模型上:
-
Static Data Flow Model: 静态数据流模型
- In this model, the structure and behavior of the graph are fixed and known beforehand.
在这种模型中,图的结构和行为是固定的并且事先已知。
- In this model, the structure and behavior of the graph are fixed and known beforehand.
-
Dynamic Data Flow Model: 动态数据流模型
- Here, the graph may change during execution based on the input data or computation results.
在该模型中,图可能根据输入数据或计算结果在执行期间发生变化。
- Here, the graph may change during execution based on the input data or computation results.
-
Synchronous Data Flow Model: 同步数据流模型
- Actors execute synchronously and typically have predictable behavior, making it suitable for real-time systems.
执行者同步运行,通常具有可预测的行为,非常适合实时系统。
- Actors execute synchronously and typically have predictable behavior, making it suitable for real-time systems.
How They Differ: 它们的区别
-
Data Items on Arcs: 弧线上的数据项
Different models specify how many data items can occupy an arc at a time.
不同的模型规定了一次弧线上可以容纳的数据项数量。 -
Internal State of Actors: 执行者的内部状态
Some models allow actors to maintain internal state, while others assume stateless actors.
一些模型允许执行者维护内部状态,而其他模型假设执行者是无状态的。 -
Execution Semantics: 执行语义
The way computations are triggered and performed differs across models.
计算的触发方式和执行方式在不同模型中各不相同。
🔎 Basic Simple DFGs 简单的基本数据流图
What is a Simple Static DFG? 什么是简单静态数据流图?
A simple static DFG is an acyclic directed graph (DAG), meaning it has no cycles. Its structure is fixed, and it is represented as follows:
-
Nodes (Actors): 节点(执行者)
- Represent operations that take a set of input values and produce a set of output values.
表示从一组输入值计算并生成一组输出值的操作。
- Represent operations that take a set of input values and produce a set of output values.
-
Arcs (Links): 弧线(连接)
- Represent the flow of data from:
- One actor's output to another actor's input.
一个执行者的输出到另一个执行者的输入。 - An input port of the DFG to an actor's input.
DFG 的输入端口到执行者的输入。 - An actor's output to an output port of the DFG.
执行者的输出到 DFG 的输出端口。
- One actor's output to another actor's input.
- Represent the flow of data from:
Key Characteristics: 关键特性
-
Deterministic Behavior: 确定性行为
- The graph has predictable outputs for given inputs.
对于给定的输入,图具有可预测的输出。
- The graph has predictable outputs for given inputs.
-
No Cycles: 无循环
- Since the graph is acyclic, computations have a clear order.
由于图是无循环的,计算具有明确的顺序。
- Since the graph is acyclic, computations have a clear order.
🌟 Examples of DFGs 数据流图示例
Figure 1: Basic Static Data Flow Graph 示例图 1:基本静态数据流图
-
The nodes are represented as circles, where each node performs a functional operation.
节点用圆圈表示,每个节点执行一个功能操作。 -
The arcs represent the flow of data between nodes.
弧线表示节点之间的数据流动。
Example Use Case 示例用例
Let’s consider a simple example of a DFG for calculating the roots of a quadratic equation (e.g., ax2+bx+c=0ax^2 + bx + c = 0):
- Input values a,b,ca, b, c.
- Compute intermediate values like b2,4ac,b2−4acb^2, 4ac, b^2 - 4ac.
- Compute the square root, and finally calculate the two roots using the quadratic formula.
In the DFG:
- Nodes represent each operation (e.g., multiplication, subtraction, square root).
- Arcs represent the data dependencies (e.g., b2b^2 flows to the subtraction operation b2−4acb^2 - 4ac).
🔧 Why Are DFGs Useful? 为什么数据流图有用?
-
Parallelism: 并行性
- DFGs help identify computations that can run in parallel.
数据流图可以帮助识别可以并行运行的计算。
- DFGs help identify computations that can run in parallel.
-
Visualization: 可视化
- They make it easy to see the dependencies and flow of data in a program.
它们使程序中的依赖关系和数据流一目了然。
- They make it easy to see the dependencies and flow of data in a program.
-
Optimization: 优化
- DFGs are used in compilers to optimize code by reordering or parallelizing computations.
数据流图用于编译器中,通过重新排序或并行化计算来优化代码。
- DFGs are used in compilers to optimize code by reordering or parallelizing computations.
🎉 Conclusion 总结
Data Flow Graphs (DFGs) provide a powerful way to model computations, emphasizing the flow of data rather than the sequence of instructions. Whether used in compiler design, hardware optimization, or real-time systems, DFGs serve as an essential tool for understanding and optimizing complex processes.
数据流图(DFG)是一种强大的建模方法,它强调的是数据的流动而非指令的顺序。无论是在编译器设计、硬件优化还是实时系统中,DFG 都是理解和优化复杂过程的重要工具。
通过掌握静态数据流图、动态数据流图和同步数据流模型,你将更好地理解程序执行的逻辑并挖掘系统的潜力!💡
我们可以通过对比 RISC-V 来帮助你理解数据流图(Data Flow Graph, DFG)和控制流图(Control Flow Graph, CFG)的概念,并展示如何使用 LLVM 获取这些图。😊
🧠 数据流图(DFG)和控制流图(CFG)概述
-
数据流图(DFG):表示程序中的数据依赖关系,尤其是操作数如何传递给不同的计算操作。它显示了数据如何在不同的操作之间流动,不关注程序的控制结构,只关心数据的传递。
比如:在一条 RISC-V 指令中,
add x1, x2, x3表示将x2和x3的值相加,并将结果存入x1,在 DFG 中,我们就能看到x2和x3数据如何流向add操作,然后x1得到结果。 -
控制流图(CFG):描述程序的控制流,即程序执行的路径。它显示了程序中所有可能的执行路径,以及如何从一个指令跳转到另一个指令。控制流图用于分析条件分支、循环等控制结构。
比如:在 RISC-V 中,
beq x1, x2, label表示如果x1 == x2,程序会跳转到label,这就会在控制流图中表现为一个分支节点。
💡 如何用 RISC-V 对比理解这些图?
我们来通过一个简单的 RISC-V 代码示例对比理解 DFG 和 CFG。
RISC-V 示例代码:
    add x3, x1, x2      # x3 = x1 + x2
    beq x3, x4, label    # if x3 == x4, jump to label
    sub x5, x6, x7      # x5 = x6 - x7
label:
    mul x8, x9, x10     # x8 = x9 * x10
1️⃣ 数据流图(DFG)
DFG 关注的是 数据依赖,也就是哪些数据需要传递给哪些操作。
对于上述代码,数据流图可以这样理解:
x1,x2输入到add指令,结果存到x3。x3输入到beq指令(它进行比较判断),如果x3 == x4,程序会跳转到label。- 在
sub指令中,x6和x7被作为输入,结果存入x5。 mul指令将x9和x10作为输入,结果存入x8。
DFG 的简化视图:
    x1 → [add] → x3 → [beq] → (branch) → label
    x2 → [add] → x3
    x6 → [sub] → x5
    x9 → [mul] → x8
    x10 → [mul] → x8
DFG 的关键点:
- 每个操作符(如
add,sub,mul)就是一个节点。 - 数据(如
x1,x2,x3等)通过箭头流动,表示它们如何传递给不同的操作。
2️⃣ 控制流图(CFG)
CFG 关注的是程序的 控制流路径,也就是指令是如何根据条件执行和跳转的。
对于上面的 RISC-V 代码,控制流图可以理解为:
- 从
add指令开始,计算x3 = x1 + x2。 - 执行
beq指令,判断x3 == x4,决定是否跳转到label。- 如果
x3 == x4,跳转到label(程序会跳过sub)。 - 如果
x3 != x4,继续执行sub。
- 如果
sub执行后,继续执行mul。
CFG 的简化视图:
  +---------+    +-----+
  |   add   | →  | beq |
  +---------+    +-----+
                    |
            +-------+-------+
            |               |
          [Jump]         [Next]
            |               |
        +--------+       +--------+
        |  label |       |  sub   |
        +--------+       +--------+
                             |
                        +--------+
                        |  mul   |
                        +--------+
CFG 的关键点:
- 节点表示程序的每个基本块(例如
add,beq,sub,mul)。 - 边表示控制流:如果满足条件(例如
beq),程序跳转到label;否则继续执行下一条指令。
🔧 如何用 LLVM 获取数据流图和控制流图?
接下来,我们看看如何用 LLVM 工具来提取这些图。LLVM 提供了丰富的工具来进行程序分析,最常见的是使用 LLVM IR(中间表示)来生成这些图。
1️⃣ 获取控制流图(CFG)
LLVM 提供了 opt 工具来生成控制流图(CFG)。首先,编译你的源代码为 LLVM IR 文件,然后使用 opt 工具生成 CFG。
步骤:
-
使用
clang或llvm-gcc编译源代码为 LLVM IR:clang -S -emit-llvm my_program.c -o my_program.ll -
使用
opt工具生成 CFG:opt -dot-cfg my_program.ll
这会在当前目录生成 .dot 文件,使用 Graphviz 等工具可以将 .dot 文件可视化为图形。
2️⃣ 获取数据流图(DFG)
LLVM 并没有直接提供内建工具生成数据流图,但你可以通过分析 LLVM IR 中的操作(例如 add, mul 等)以及它们的操作数来手动绘制数据流图。你可以编写脚本,分析每个指令的输入输出关系,进而生成一个数据流图。
或者,你也可以使用 llvm::Value 和 llvm::Instruction 等数据结构来手动提取指令的依赖关系,构建数据流图。
🎉 总结与类比
- RISC-V 中的每一条指令都可以看作是一个“操作节点”,它们的数据传递关系在 数据流图(DFG) 中表现为数据如何从一个指令流向另一个。
- 在 控制流图(CFG) 中,程序的每条指令和它们的分支结构(如条件跳转)形成了一个“控制节点”,帮助我们理解程序的执行路径。
通过理解这些图的基本概念,你可以深入分析程序的执行逻辑,优化性能,甚至调试错误。你可以通过 LLVM 的 IR 来提取这些图,从而更好地理解和优化你的代码。
这个图展示了 数据流图(Data Flow Graph, DFG) 的概念,它是程序中数据依赖关系的可视化表示。我们以求解二次方程(quad(a, b, c))的例子来分析,逐步理解图中内容。
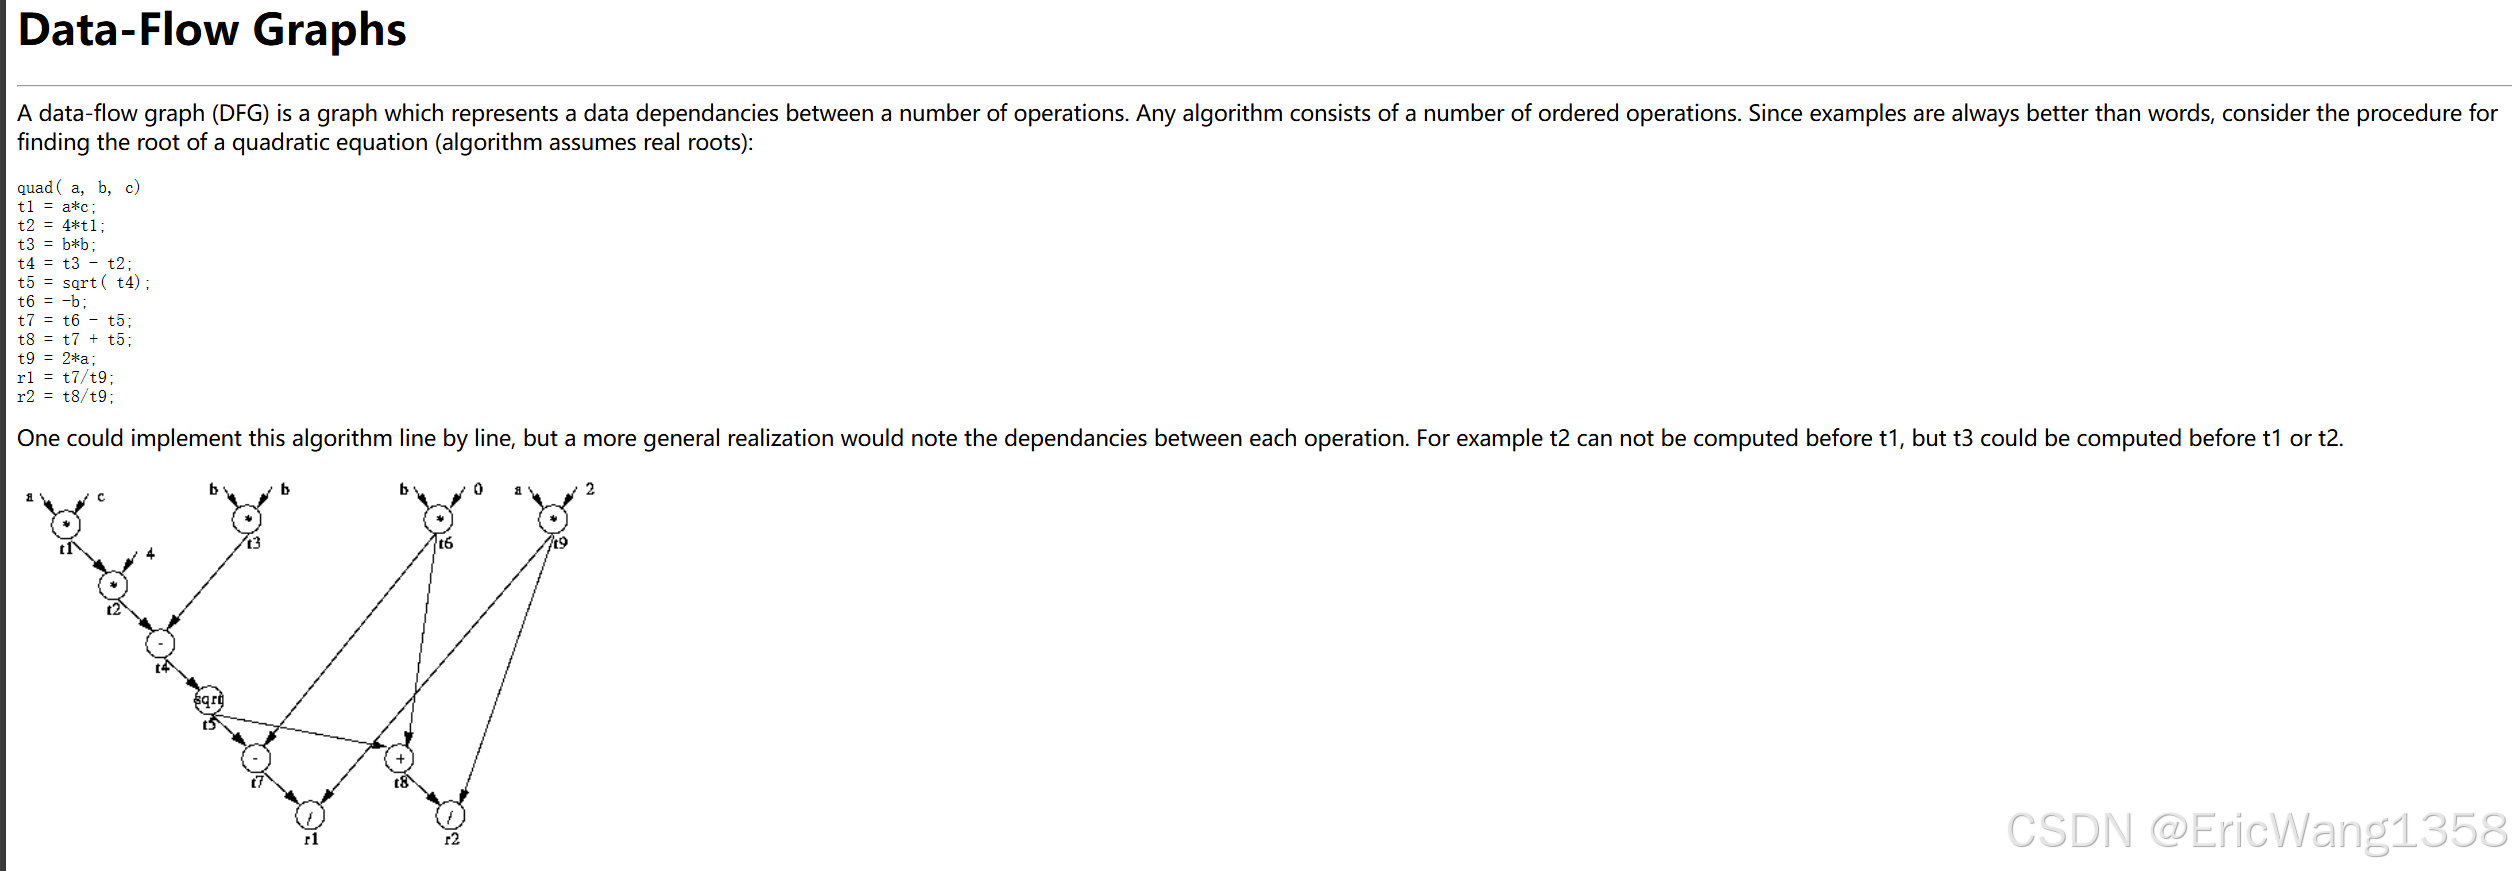
A data-flow graph (DFG) is a graph which represents a data dependancies between a number of operations. Any algorithm consists of a number of ordered operations. Since examples are always better than words, consider the procedure for finding the root of a quadratic equation (algorithm assumes real roots):
1️⃣ 算法解析
二次方程的根公式是:
代码的实现通过以下步骤计算:
quad(a, b, c) {
    t1 = a * c;             # t1 表示 a 和 c 的乘积
    t2 = 4 * t1;            # t2 表示 4ac
    t3 = b * b;             # t3 表示 b 的平方
    t4 = t3 - t2;           # t4 表示 b^2 - 4ac
    t5 = sqrt(t4);          # t5 表示根号部分 sqrt(b^2 - 4ac)
    t6 = -b;                # t6 表示 -b
    t7 = t6 - t5;           # t7 表示分子中的 -b - sqrt(b^2 - 4ac)
    t8 = t7 + t5;           # t8 表示分子中的 -b + sqrt(b^2 - 4ac)
    t9 = 2 * a;             # t9 表示分母 2a
    r1 = t7 / t9;           # r1 表示第一个根 (-b - sqrt(b^2 - 4ac)) / 2a
    r2 = t8 / t9;           # r2 表示第二个根 (-b + sqrt(b^2 - 4ac)) / 2a
}
这段代码分步骤实现了公式的各部分计算,而数据流图用于表示这些步骤的数据依赖关系。
2️⃣ 数据流图(DFG)分析
数据流图展示了不同变量之间的数据依赖。以下是该 DFG 的核心要点: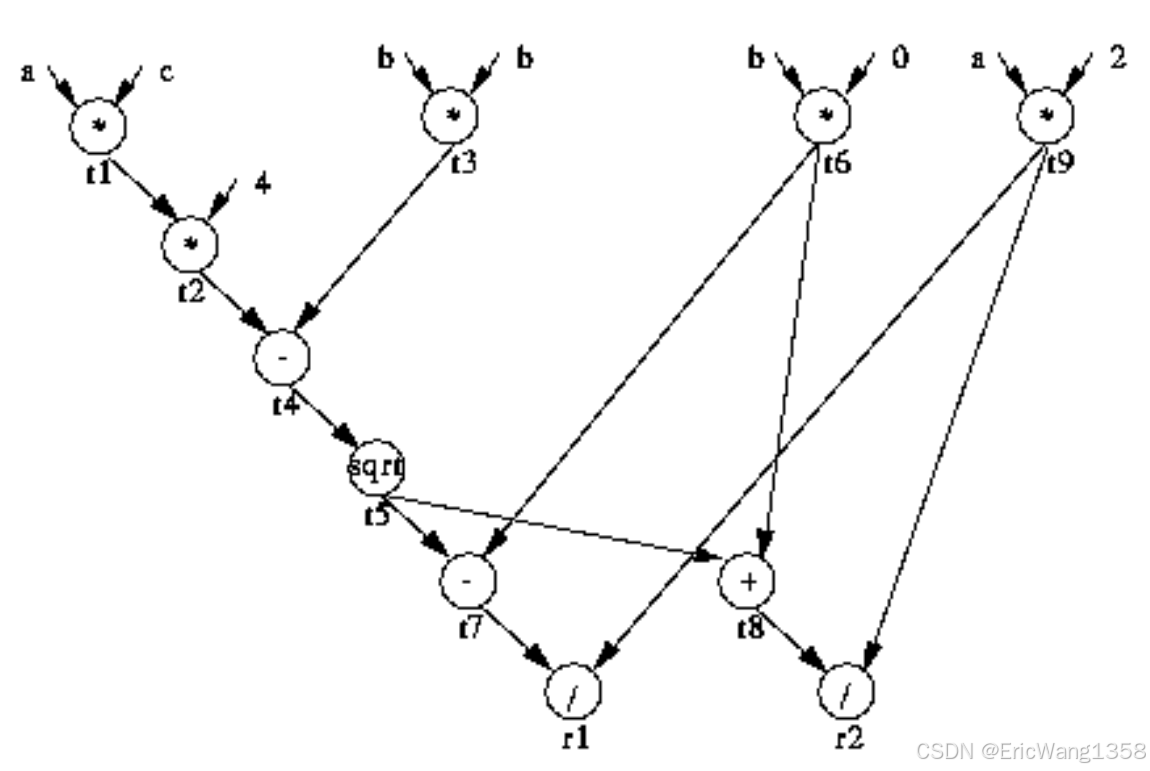
依赖关系
- 输入变量:
a,b,c是方程的输入。- 它们作为数据的来源,直接流向相关的操作节点。
- 操作顺序:
t1 = a * c: 依赖于a和c的值。t2 = 4 * t1: 依赖于t1,即依赖于之前的乘法结果。t3 = b * b: 独立计算,直接依赖于b。t4 = t3 - t2: 依赖于t3和t2。t5 = sqrt(t4): 依赖于t4。t6 = -b: 仅依赖于b。t7 = t6 - t5: 依赖于t6和t5。t8 = t7 + t5: 依赖于t7和t5。t9 = 2 * a: 依赖于a。r1 = t7 / t9和r2 = t8 / t9: 分别依赖于t7和t9、t8和t9。
并行性
- 独立计算的部分可以并行执行:
t1和t3可以同时计算,因为它们的输入变量没有交集。- 类似地,
t6和t5的计算可以并行。
约束
- 计算
t2之前必须完成t1。 - 计算
t4之前必须完成t2和t3。 - 计算
t5之前必须完成t4。 - …以此类推。
3️⃣ 图中的表示
图的结构:
- 节点(Nodes):图中的每个圆圈表示一个操作(例如
*,-,sqrt,/等)。 - 边(Edges):箭头表示数据从一个节点流向另一个节点。例如,
a和c的边指向*(对应t1 = a * c),表示a和c是该乘法操作的输入。
并行性直观展示:
在图中可以看到并行的可能性。例如:
t3 = b * b和t1 = a * c没有依赖关系,可以并行计算。- 在
t4被计算之前,t2和t3必须完成。
4️⃣ 为什么需要数据流图?
数据流图的意义:
- 优化程序:数据流图可以帮助编译器识别哪些操作可以并行执行,从而优化程序性能(尤其在多核系统中)。
- 例如,
t1和t3是独立的操作,可以在不同的核心上并行执行。
- 例如,
- 可视化依赖关系:它清晰地展示了每个计算步骤需要哪些输入,以及如何产生输出。
- 比如:你可以直观地看到
t9是如何影响最终结果的。
- 比如:你可以直观地看到
- 架构设计:在硬件实现中(比如 RISC-V),数据流图可以帮助设计流水线,最大化硬件资源利用率。
5️⃣ 如何与 LLVM 结合?
如果我们用 LLVM 来分析这段代码,LLVM 的中间表示(LLVM IR)就能很方便地构建数据流图。
步骤:
-
将代码转为 LLVM IR: 使用 Clang 编译器将 C/C++ 代码转化为 LLVM IR。
clang -S -emit-llvm quad.c -o quad.ll -
分析数据流: 通过 LLVM 提供的
opt工具,可以分析指令的依赖关系。例如:opt -view-cfg quad.ll虽然这是控制流图的工具,但你也可以通过自定义
pass提取指令的输入和输出,生成类似数据流图的依赖信息。 -
使用自定义 Pass: LLVM 允许你编写自己的
pass,通过分析每个指令的依赖,生成对应的数据流图。


 979
979

 被折叠的 条评论
为什么被折叠?
被折叠的 条评论
为什么被折叠?
 到【灌水乐园】发言


