


这篇笔记瞄准的是AutoGen库中 Examples 章节的 Company Research 示例,其总体难度不算很高,主要是对自定义 tool 的练习。
- 官网链接: https://microsoft.github.io/autogen/stable/user-guide/agentchat-user-guide/examples/company-research.html ;
申请Google Search API
获取 GOOGLE_API_KEY
这个示例以及接下来的一个示例都需要 Google Search API ,具体申请方法我在先前的 smolagents 系列笔记中有提到过,国内的手机号也可以使用,申请免费(100次/月)的计划对于新手而言完全足够了,详细信息见下面链接中的 Use LangChain tools 部分:
- smolagents学习笔记系列(五)Tools-in-depth-guide: https://blog.csdn.net/nenchoumi3119/article/details/145851152?spm=1001.2014.3001.5501 ;
获取 GOOGLE_SEARCH_ENGINE_ID
官网的这个demo中还需要提供一个Search Engine ID,这个在上面的界面中没有列出,需要前往下面这个网页去找自己订阅计划可以使用的ID:
- Programmable Search Engine ID:https://support.google.com/programmable-search/answer/12499034?hl=en ;
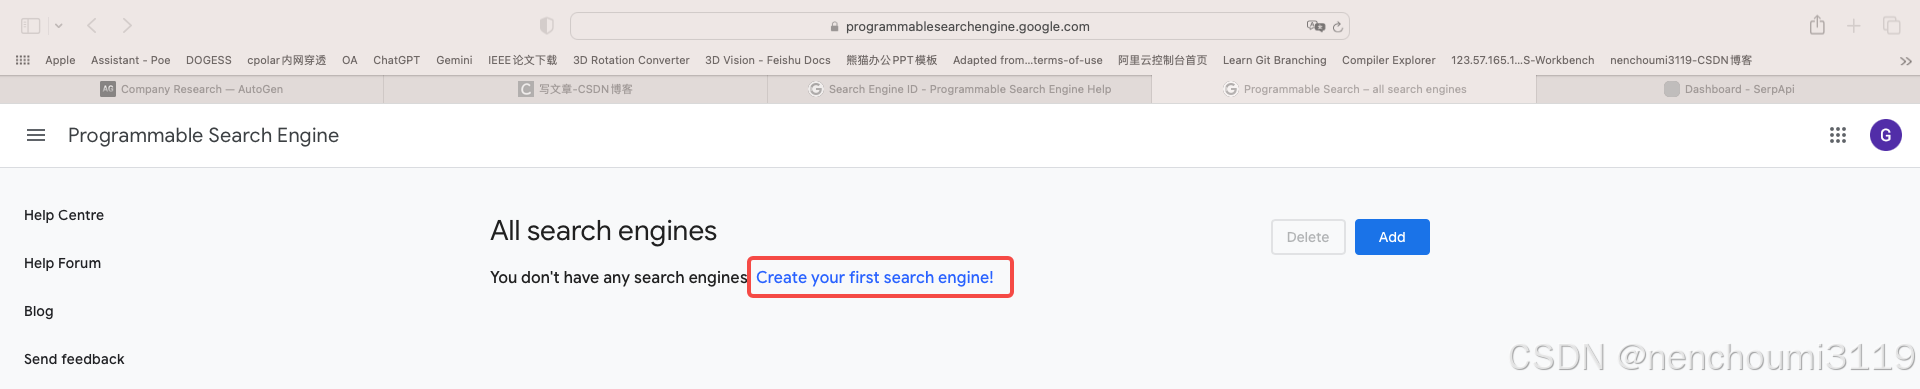
如果你是第一次登录或者申请,看到的页面应该如下,点击红框中的 search engines 会弹出下面的界面:

在新弹出的界面中点击红框中的 Create your first search engine 链接:
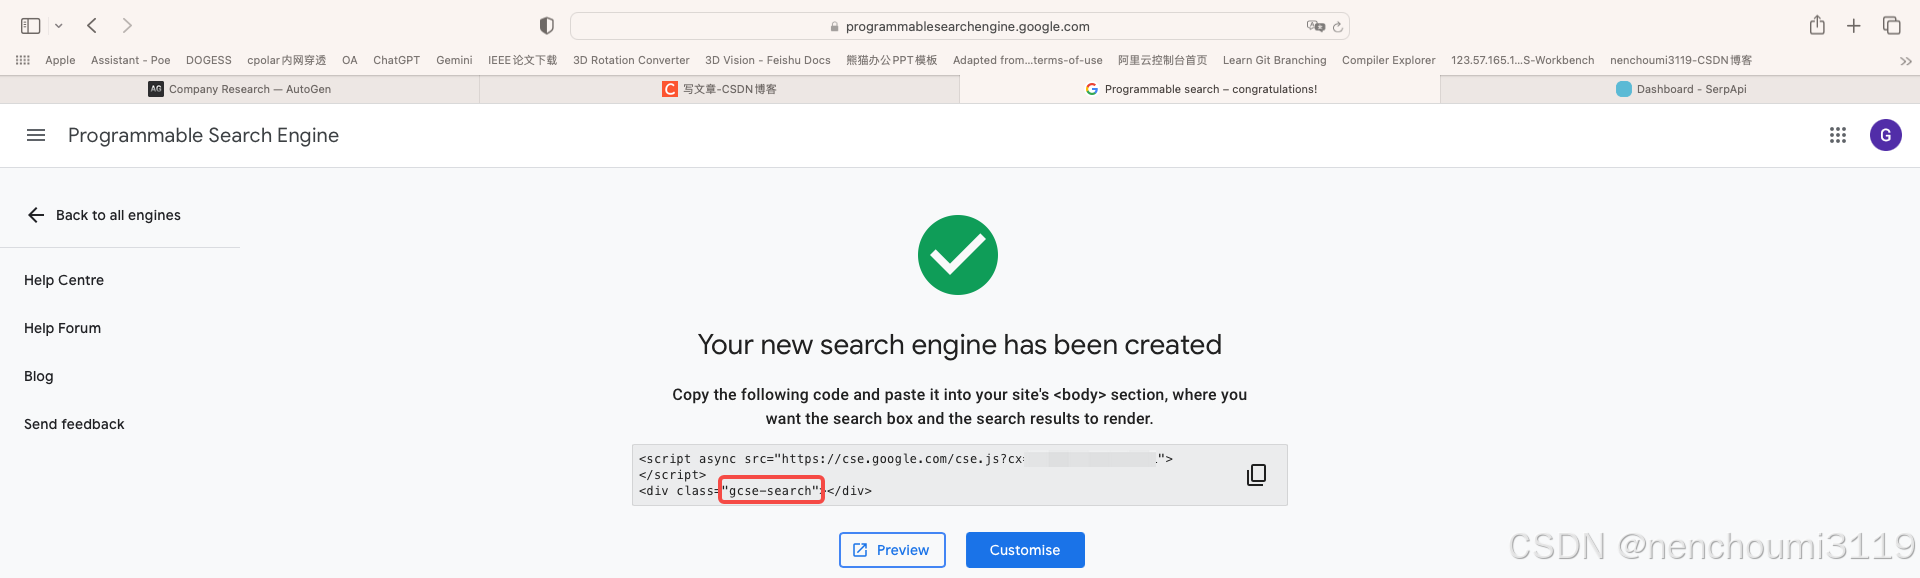
在弹出的界面中按照下面进行配置,其中 Search the entire web 是必须勾选的,否则demo无法运行: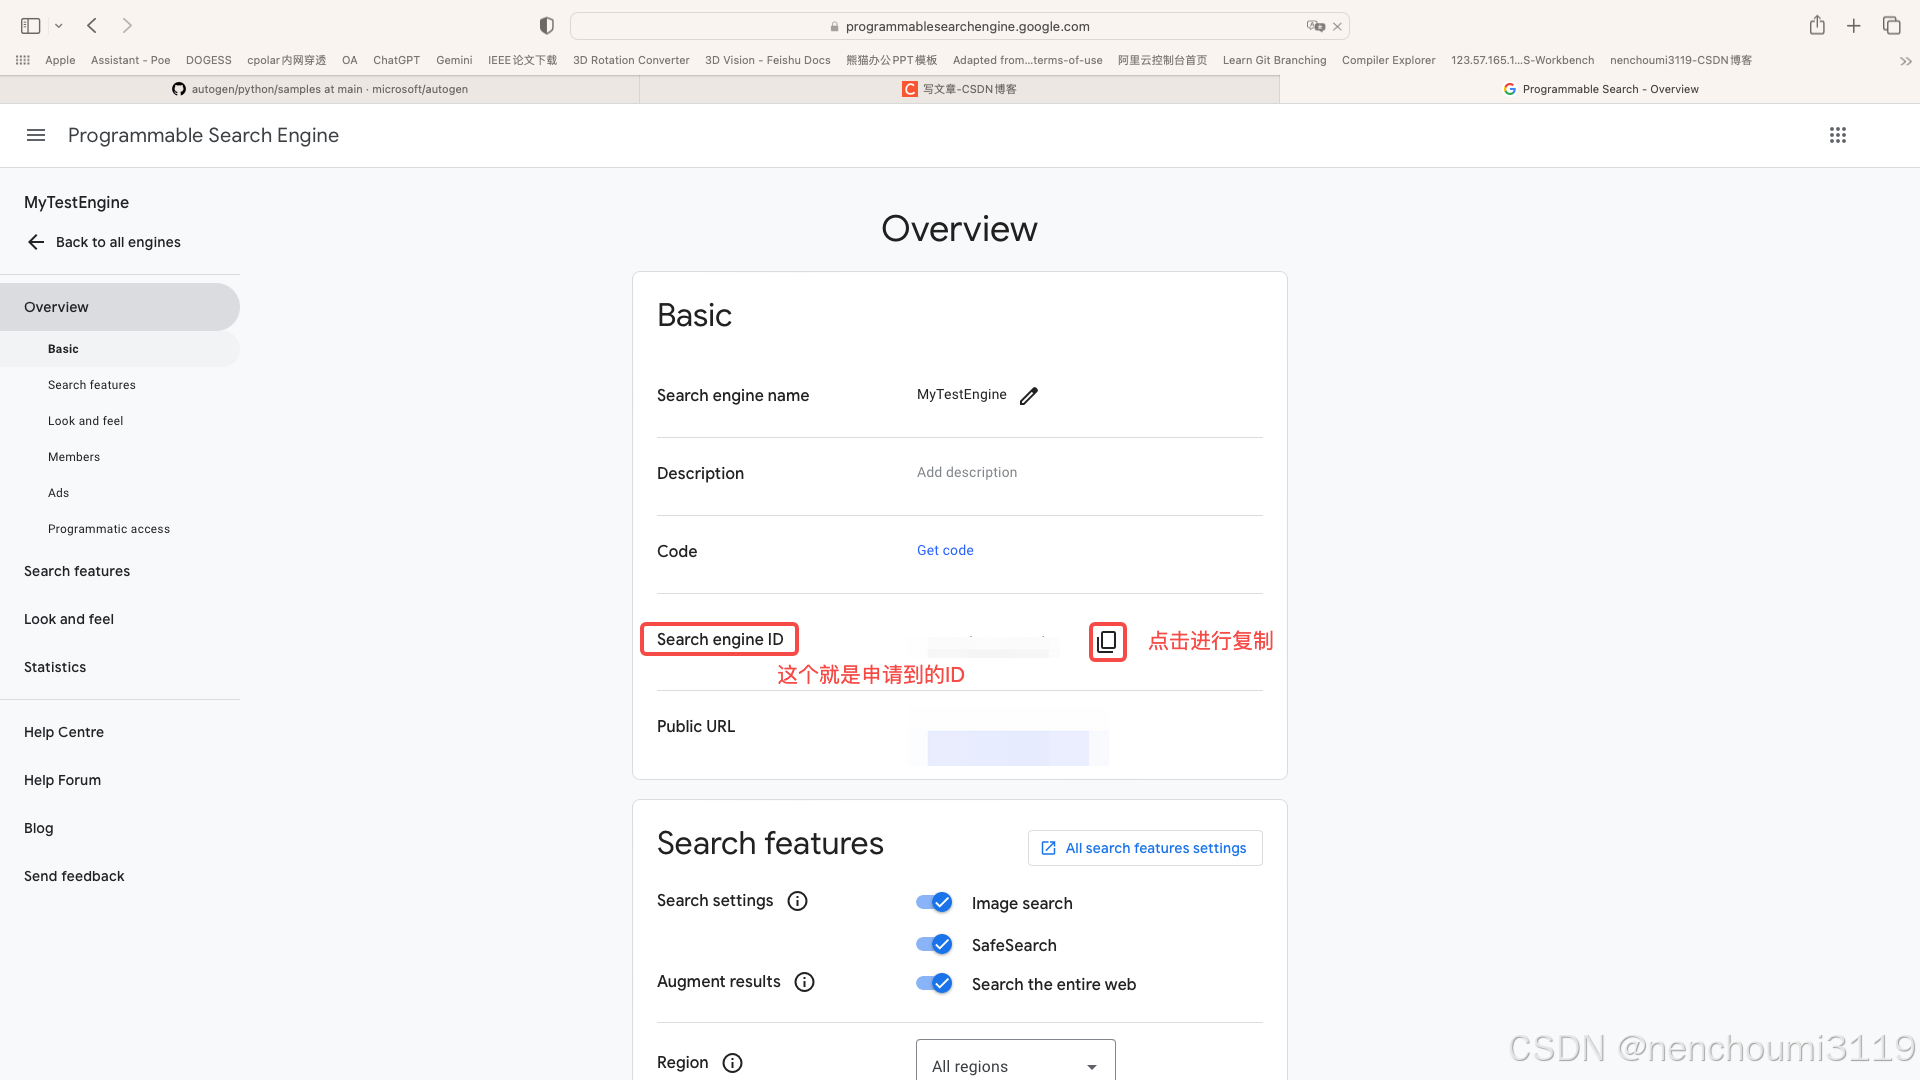
完成验证后会弹出下面页面表示申请完成,然后点击 Customise 按钮:
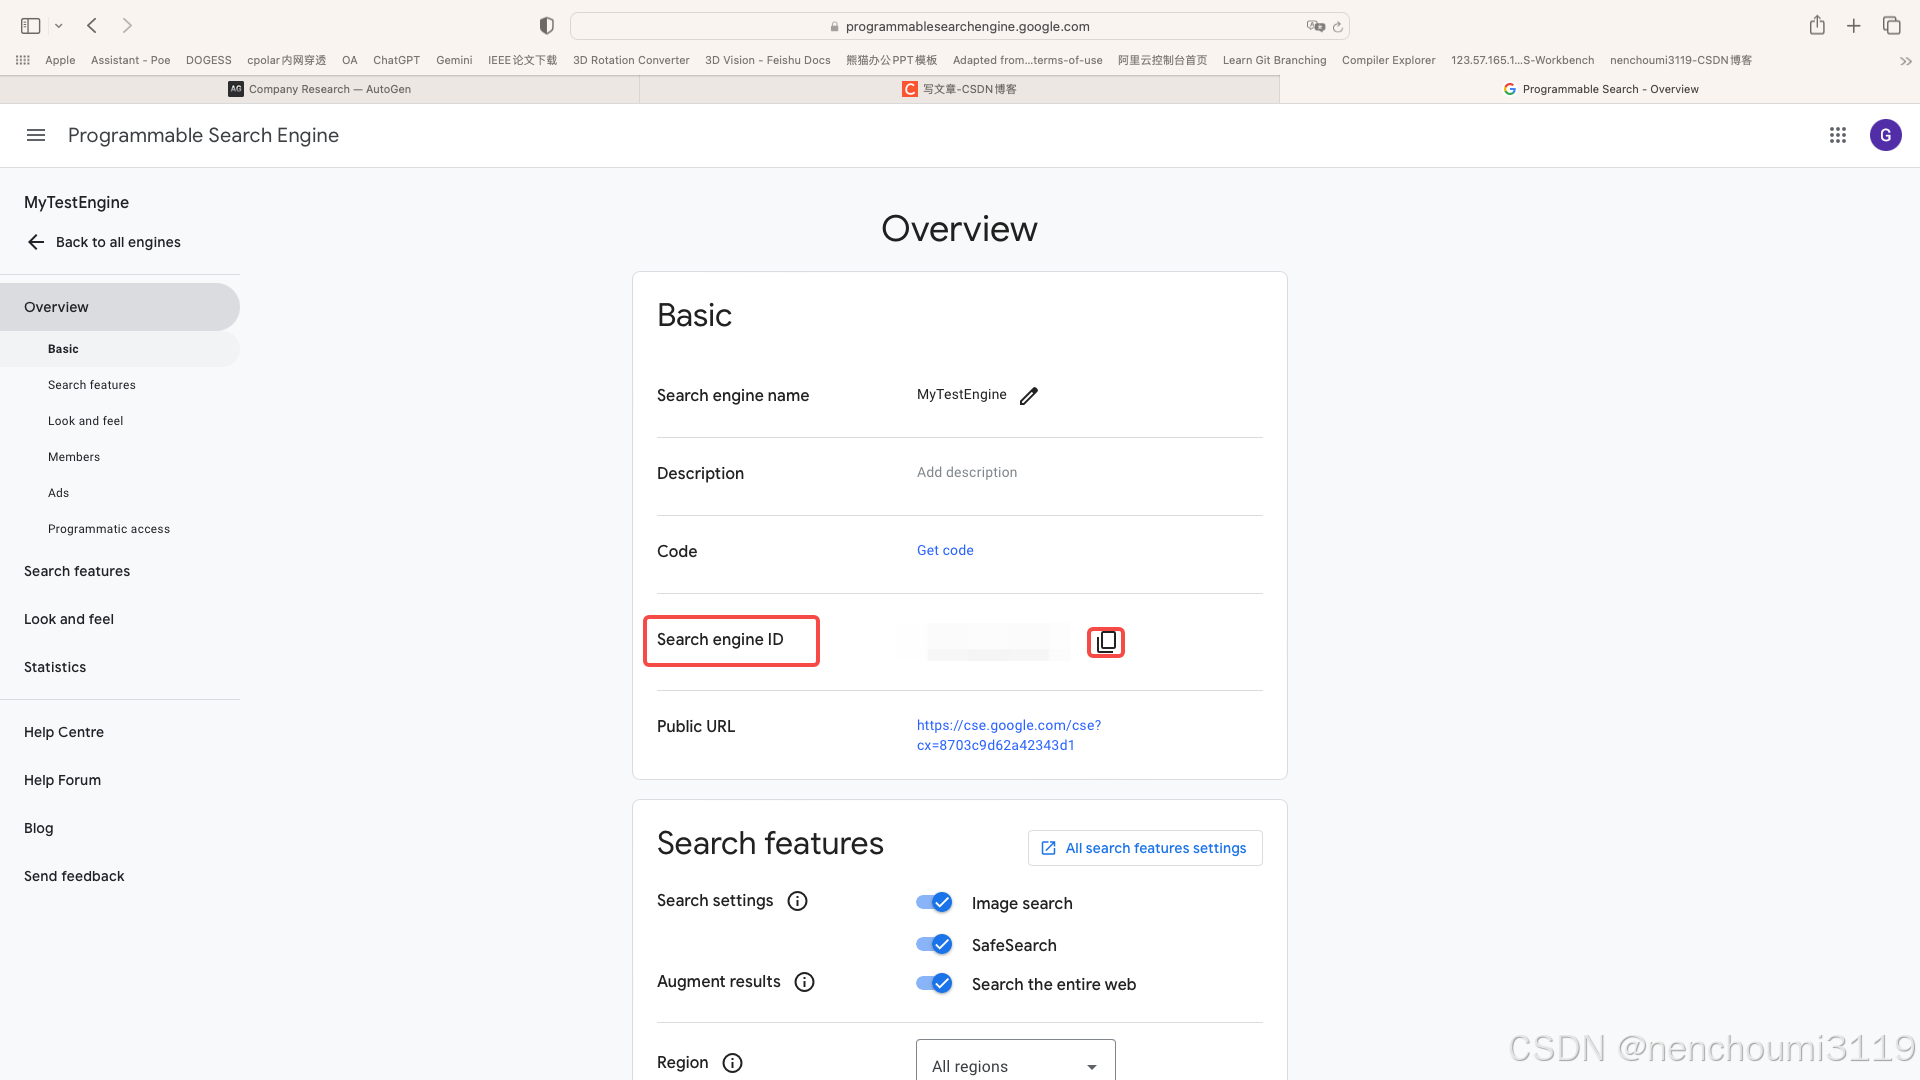
找到刚才指定的那个Search Engine,可以看到下面的界面,这个 Search engine ID 就是我们需要的ID:
至此,我们应该有了两个关键的KEY,后面要用到:
- GOOGLE_API_KEY;
- GOOGLE_SEARCH_ENGINE_ID;
Company Research
公司调研示例展示了一个顺序执行的Team,其功能是先搜索指定公司的信息,然后对其股价进行分析,最后在生成调查报告。其中怎么设计Tema和对Agent的定义都不是重点,重点在于使用 Google Research API 并对其返回值进行解析,这部分需要手动编码。
Step1. 安装依赖:
$ pip install yfinance matplotlib pytz numpy pandas python-dotenv requests bs4
Step2. 定义使用Google Search Engine的工具google_search 函数:
def google_search(query: str, num_results: int = 2, max_chars: int = 500) -> list:  # type: ignore[type-arg]
    import os
    import time

    import requests
    from bs4 import BeautifulSoup
    from dotenv import load_dotenv

    load_dotenv()

    api_key = os.getenv("GOOGLE_API_KEY")
    search_engine_id = os.getenv("GOOGLE_SEARCH_ENGINE_ID")

    if not api_key or not search_engine_id:
        raise ValueError("API key or Search Engine ID not found in environment variables")

    url = "https://customsearch.googleapis.com/customsearch/v1"
    params = {"key": str(api_key), "cx": str(search_engine_id), "q": str(query), "num": str(num_results)}

    response = requests.get(url, params=params)

    if response.status_code != 200:
        print(response.json())
        raise Exception(f"Error in API request: {response.status_code}")

    results = response.json().get("items", [])

    def get_page_content(url: str) -> str:
        try:
            response = requests.get(url, timeout=10)
            soup = BeautifulSoup(response.content, "html.parser")
            text = soup.get_text(separator=" ", strip=True)
            words = text.split()
            content = ""
            for word in words:
                if len(content) + len(word) + 1 > max_chars:
                    break
                content += " " + word
            return content.strip()
        except Exception as e:
            print(f"Error fetching {url}: {str(e)}")
            return ""

    enriched_results = []
    for item in results:
        body = get_page_content(item["link"])
        enriched_results.append(
            {"title": item["title"], "link": item["link"], "snippet": item["snippet"], "body": body}
        )
        time.sleep(1)  # Be respectful to the servers

    return enriched_results
Step3. 定义用来分析股票的工具函数 analyze_stock:
def analyze_stock(ticker: str) -> dict:  # type: ignore[type-arg]
    import os
    from datetime import datetime, timedelta

    import matplotlib.pyplot as plt
    import numpy as np
    import pandas as pd
    import yfinance as yf
    from pytz import timezone  # type: ignore

    stock = yf.Ticker(ticker)

    # Get historical data (1 year of data to ensure we have enough for 200-day MA)
    end_date = datetime.now(timezone("UTC"))
    start_date = end_date - timedelta(days=365)
    hist = stock.history(start=start_date, end=end_date)

    # Ensure we have data
    if hist.empty:
        return {"error": "No historical data available for the specified ticker."}

    # Compute basic statistics and additional metrics
    current_price = stock.info.get("currentPrice", hist["Close"].iloc[-1])
    year_high = stock.info.get("fiftyTwoWeekHigh", hist["High"].max())
    year_low = stock.info.get("fiftyTwoWeekLow", hist["Low"].min())

    # Calculate 50-day and 200-day moving averages
    ma_50 = hist["Close"].rolling(window=50).mean().iloc[-1]
    ma_200 = hist["Close"].rolling(window=200).mean().iloc[-1]

    # Calculate YTD price change and percent change
    ytd_start = datetime(end_date.year, 1, 1, tzinfo=timezone("UTC"))
    ytd_data = hist.loc[ytd_start:]  # type: ignore[misc]
    if not ytd_data.empty:
        price_change = ytd_data["Close"].iloc[-1] - ytd_data["Close"].iloc[0]
        percent_change = (price_change / ytd_data["Close"].iloc[0]) * 100
    else:
        price_change = percent_change = np.nan

    # Determine trend
    if pd.notna(ma_50) and pd.notna(ma_200):
        if ma_50 > ma_200:
            trend = "Upward"
        elif ma_50 < ma_200:
            trend = "Downward"
        else:
            trend = "Neutral"
    else:
        trend = "Insufficient data for trend analysis"

    # Calculate volatility (standard deviation of daily returns)
    daily_returns = hist["Close"].pct_change().dropna()
    volatility = daily_returns.std() * np.sqrt(252)  # Annualized volatility

    # Create result dictionary
    result = {
        "ticker": ticker,
        "current_price": current_price,
        "52_week_high": year_high,
        "52_week_low": year_low,
        "50_day_ma": ma_50,
        "200_day_ma": ma_200,
        "ytd_price_change": price_change,
        "ytd_percent_change": percent_change,
        "trend": trend,
        "volatility": volatility,
    }

    # Convert numpy types to Python native types for better JSON serialization
    for key, value in result.items():
        if isinstance(value, np.generic):
            result[key] = value.item()

    # Generate plot
    plt.figure(figsize=(12, 6))
    plt.plot(hist.index, hist["Close"], label="Close Price")
    plt.plot(hist.index, hist["Close"].rolling(window=50).mean(), label="50-day MA")
    plt.plot(hist.index, hist["Close"].rolling(window=200).mean(), label="200-day MA")
    plt.title(f"{ticker} Stock Price (Past Year)")
    plt.xlabel("Date")
    plt.ylabel("Price ($)")
    plt.legend()
    plt.grid(True)

    # Save plot to file
    os.makedirs("coding", exist_ok=True)
    plot_file_path = f"coding/{ticker}_stockprice.png"
    plt.savefig(plot_file_path)
    print(f"Plot saved as {plot_file_path}")
    result["plot_file_path"] = plot_file_path

    return result
Step4. 将上面两个工具函数用 FunctionTool 进行一次打包:
google_search_tool = FunctionTool(
    google_search, description="Search Google for information, returns results with a snippet and body content"
)
stock_analysis_tool = FunctionTool(analyze_stock, description="Analyze stock data and generate a plot")
Step5. 定义三个Agent
- 使用
google_search_tool工具进行搜索的Agentsearch_agent:
search_agent = AssistantAgent(
    name="Google_Search_Agent",
    model_client=OpenAIChatCompletionClient(model="gpt-4o"),
    tools=[google_search_tool],
    description="Search Google for information, returns top 2 results with a snippet and body content",
    system_message="You are a helpful AI assistant. Solve tasks using your tools.",
)
- 使用
stock_analysis_agent工具对股票进行分析的Agentstock_analysis_agent:
stock_analysis_agent = AssistantAgent(
    name="Stock_Analysis_Agent",
    model_client=OpenAIChatCompletionClient(model="gpt-4o"),
    tools=[stock_analysis_tool],
    description="Analyze stock data and generate a plot",
    system_message="Perform data analysis.",
)
- 对整个报告进行分析的Agent
report_agent:
report_agent = AssistantAgent(
    name="Report_Agent",
    model_client=OpenAIChatCompletionClient(model="gpt-4o"),
    description="Generate a report based the search and results of stock analysis",
    system_message="You are a helpful assistant that can generate a comprehensive report on a given topic based on search and stock analysis. When you done with generating the report, reply with TERMINATE.",
)
Step6. 创建Team并定义task
team = RoundRobinGroupChat([stock_analysis_agent, search_agent, report_agent], max_turns=3)

stream = team.run_stream(task="Write a financial report on American airlines")
asyncio.run(
    Console(stream)
)
完整代码:
from autogen_agentchat.agents import AssistantAgent
from autogen_agentchat.teams import RoundRobinGroupChat
from autogen_agentchat.ui import Console
from autogen_core.tools import FunctionTool
from autogen_ext.models.openai import OpenAIChatCompletionClient
import os, asyncio

os.environ["GOOGLE_SEARCH_ENGINE_ID"] = "你的GOOGLE_SEARCH_ENGINE_ID"	# Google
os.environ["GOOGLE_API_KEY"] = "你的GOOGLE_API_KEY"						# Google
os.environ["OPENAI_API_KEY"] = "你的OPENAI_API_KEY"						# OpenAI

#-----------------------------------------------------------#
# Step1. 定义两个工具函数
def google_search(query: str, num_results: int = 2, max_chars: int = 500) -> list:  # type: ignore[type-arg]
    import os
    import time

    import requests
    from bs4 import BeautifulSoup
    from dotenv import load_dotenv

    load_dotenv()

    api_key = os.getenv("GOOGLE_API_KEY")
    search_engine_id = os.getenv("GOOGLE_SEARCH_ENGINE_ID")

    if not api_key or not search_engine_id:
        raise ValueError("API key or Search Engine ID not found in environment variables")

    url = "https://customsearch.googleapis.com/customsearch/v1"
    params = {"key": str(api_key), "cx": str(search_engine_id), "q": str(query), "num": str(num_results)}

    response = requests.get(url, params=params)

    if response.status_code != 200:
        print(response.json())
        raise Exception(f"Error in API request: {response.status_code}")

    results = response.json().get("items", [])

    def get_page_content(url: str) -> str:
        try:
            response = requests.get(url, timeout=10)
            soup = BeautifulSoup(response.content, "html.parser")
            text = soup.get_text(separator=" ", strip=True)
            words = text.split()
            content = ""
            for word in words:
                if len(content) + len(word) + 1 > max_chars:
                    break
                content += " " + word
            return content.strip()
        except Exception as e:
            print(f"Error fetching {url}: {str(e)}")
            return ""

    enriched_results = []
    for item in results:
        body = get_page_content(item["link"])
        enriched_results.append(
            {"title": item["title"], "link": item["link"], "snippet": item["snippet"], "body": body}
        )
        time.sleep(1)  # Be respectful to the servers

    return enriched_results

def analyze_stock(ticker: str) -> dict:  # type: ignore[type-arg]
    import os
    from datetime import datetime, timedelta

    import matplotlib.pyplot as plt
    import numpy as np
    import pandas as pd
    import yfinance as yf
    from pytz import timezone  # type: ignore

    stock = yf.Ticker(ticker)

    # Get historical data (1 year of data to ensure we have enough for 200-day MA)
    end_date = datetime.now(timezone("UTC"))
    start_date = end_date - timedelta(days=365)
    hist = stock.history(start=start_date, end=end_date)

    # Ensure we have data
    if hist.empty:
        return {"error": "No historical data available for the specified ticker."}

    # Compute basic statistics and additional metrics
    current_price = stock.info.get("currentPrice", hist["Close"].iloc[-1])
    year_high = stock.info.get("fiftyTwoWeekHigh", hist["High"].max())
    year_low = stock.info.get("fiftyTwoWeekLow", hist["Low"].min())

    # Calculate 50-day and 200-day moving averages
    ma_50 = hist["Close"].rolling(window=50).mean().iloc[-1]
    ma_200 = hist["Close"].rolling(window=200).mean().iloc[-1]

    # Calculate YTD price change and percent change
    ytd_start = datetime(end_date.year, 1, 1, tzinfo=timezone("UTC"))
    ytd_data = hist.loc[ytd_start:]  # type: ignore[misc]
    if not ytd_data.empty:
        price_change = ytd_data["Close"].iloc[-1] - ytd_data["Close"].iloc[0]
        percent_change = (price_change / ytd_data["Close"].iloc[0]) * 100
    else:
        price_change = percent_change = np.nan

    # Determine trend
    if pd.notna(ma_50) and pd.notna(ma_200):
        if ma_50 > ma_200:
            trend = "Upward"
        elif ma_50 < ma_200:
            trend = "Downward"
        else:
            trend = "Neutral"
    else:
        trend = "Insufficient data for trend analysis"

    # Calculate volatility (standard deviation of daily returns)
    daily_returns = hist["Close"].pct_change().dropna()
    volatility = daily_returns.std() * np.sqrt(252)  # Annualized volatility

    # Create result dictionary
    result = {
        "ticker": ticker,
        "current_price": current_price,
        "52_week_high": year_high,
        "52_week_low": year_low,
        "50_day_ma": ma_50,
        "200_day_ma": ma_200,
        "ytd_price_change": price_change,
        "ytd_percent_change": percent_change,
        "trend": trend,
        "volatility": volatility,
    }

    # Convert numpy types to Python native types for better JSON serialization
    for key, value in result.items():
        if isinstance(value, np.generic):
            result[key] = value.item()

    # Generate plot
    plt.figure(figsize=(12, 6))
    plt.plot(hist.index, hist["Close"], label="Close Price")
    plt.plot(hist.index, hist["Close"].rolling(window=50).mean(), label="50-day MA")
    plt.plot(hist.index, hist["Close"].rolling(window=200).mean(), label="200-day MA")
    plt.title(f"{ticker} Stock Price (Past Year)")
    plt.xlabel("Date")
    plt.ylabel("Price ($)")
    plt.legend()
    plt.grid(True)

    # Save plot to file
    os.makedirs("coding", exist_ok=True)
    plot_file_path = f"coding/{ticker}_stockprice.png"
    plt.savefig(plot_file_path)
    print(f"Plot saved as {plot_file_path}")
    result["plot_file_path"] = plot_file_path

    return result

#-----------------------------------------------------------#
# Step2. 将工具函数用 FunctionTool 对象进行一次打包:
google_search_tool = FunctionTool(
    google_search, description="Search Google for information, returns results with a snippet and body content"
)
stock_analysis_tool = FunctionTool(analyze_stock, description="Analyze stock data and generate a plot")

#-----------------------------------------------------------#
# Step3. 定义三个Agent
search_agent = AssistantAgent(
    name="Google_Search_Agent",
    model_client=OpenAIChatCompletionClient(model="gpt-4o"),
    tools=[google_search_tool],
    description="Search Google for information, returns top 2 results with a snippet and body content",
    system_message="You are a helpful AI assistant. Solve tasks using your tools.",
)

stock_analysis_agent = AssistantAgent(
    name="Stock_Analysis_Agent",
    model_client=OpenAIChatCompletionClient(model="gpt-4o"),
    tools=[stock_analysis_tool],
    description="Analyze stock data and generate a plot",
    system_message="Perform data analysis.",
)

report_agent = AssistantAgent(
    name="Report_Agent",
    model_client=OpenAIChatCompletionClient(model="gpt-4o"),
    description="Generate a report based the search and results of stock analysis",
    system_message="You are a helpful assistant that can generate a comprehensive report on a given topic based on search and stock analysis. When you done with generating the report, reply with TERMINATE.",
)

#-----------------------------------------------------------#
# Step4. 定义 Team 与 Task
team = RoundRobinGroupChat([stock_analysis_agent, search_agent, report_agent], max_turns=3)

stream = team.run_stream(task="Write a financial report on American airlines")
asyncio.run(
    Console(stream)
)
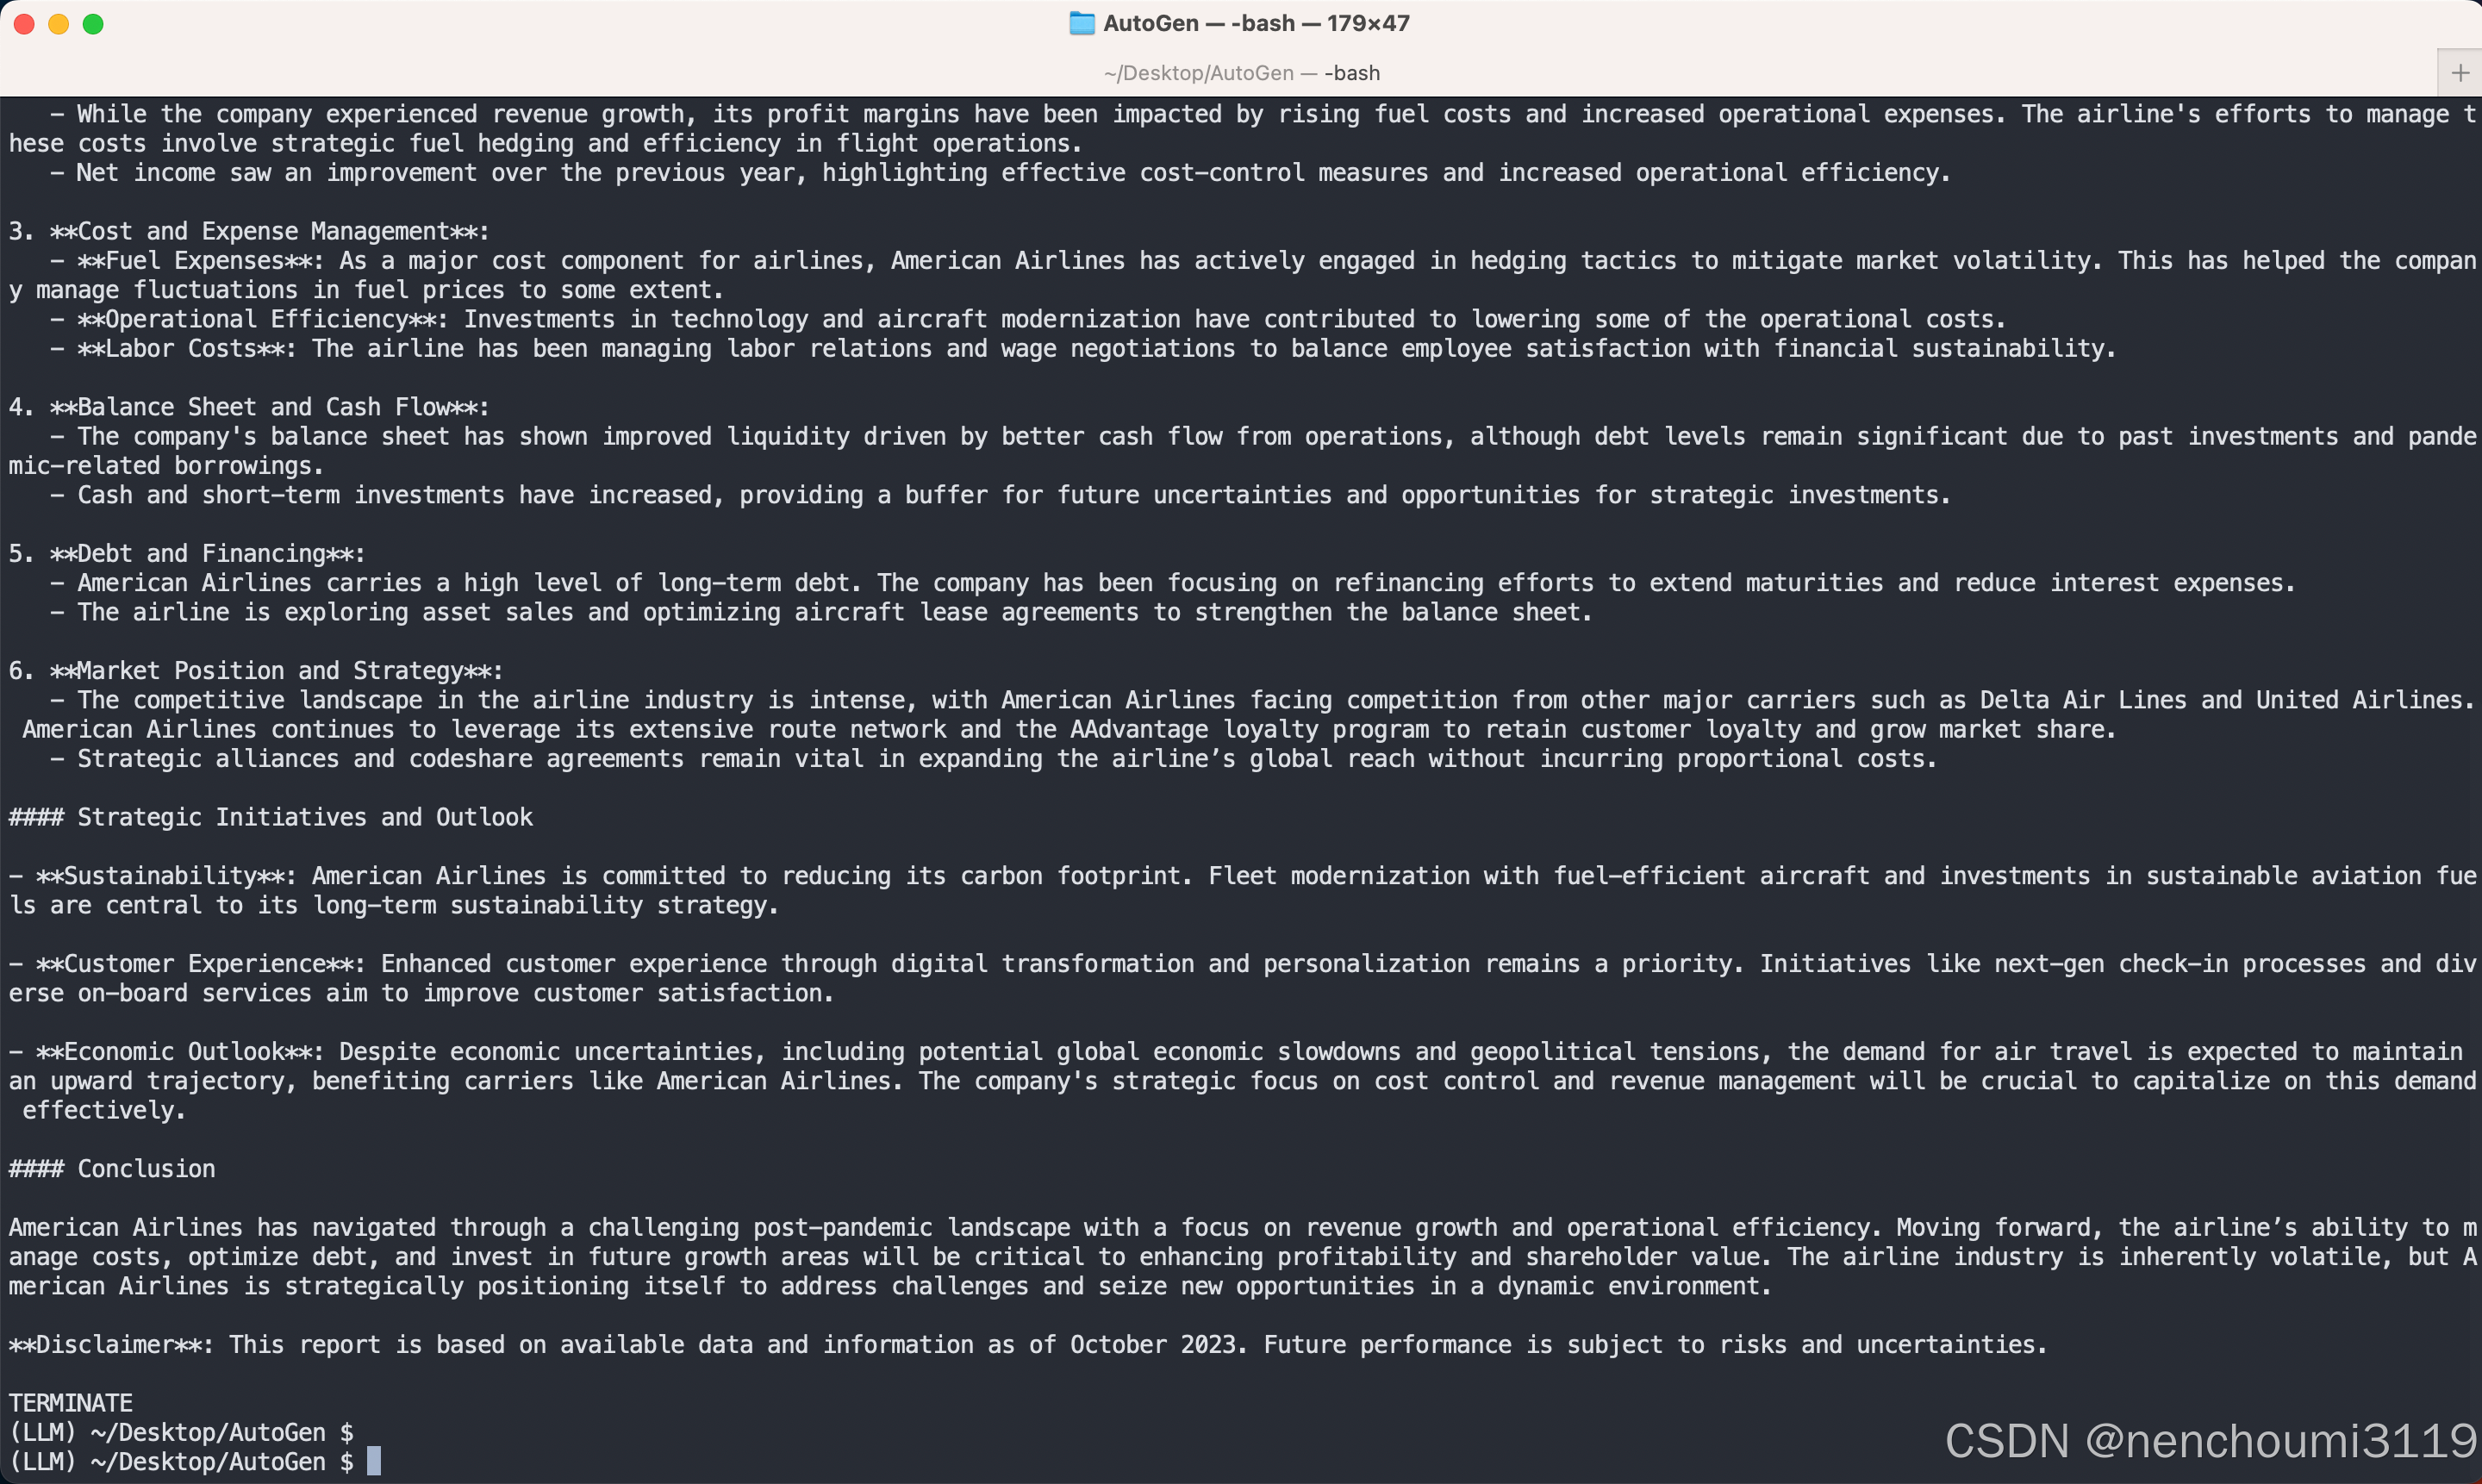
运行结果如下:
$ python demo.py
【注意】:
- 建议选择一个稳定的网络运行,否则容易报错;
- 运行后出现下面的报错不必担心,因为AutoGen提供了task重询机制(我们之前提到过),Team会自动重新向LLM进行询问,但是如果你一直循环爆这个错建议终止程序后等待一小会儿再尝试:
[FunctionExecutionResult(content='Error: Too Many Requests. Rate limited. Try after a while.', call_id='call_m5Ur686aCrTGOn8eHu3mxxFV', is_error=True)]
Error: Too Many Requests. Rate limited. Try after a while.


 1032
1032

 被折叠的 条评论
为什么被折叠?
被折叠的 条评论
为什么被折叠?
 到【灌水乐园】发言


