


What is Principal Component Analysis?
PCA(Principal Component Analysis)
- An unsupervised machine learning algorithm. (一个非监督的机器学习算法)
- Mainly used for dimensionality reduction. (主要用于数据的降维)
- Through dimensionality reduction, we can find features that are easier for humans to understand or analysis. (通过降维,可以发现更便于人类理解的特征)
- Other applications: visualisation, de-noising. (其他应用:可视化;去噪)
Simple explanation of PCA

This is a 2D data sample, if we want to do dimensionality reduction, we can reduce it to 1 dimension. So, how to reduce?
One obviously way here is, for both features, choose one feature and discard the other. For example, if we choose feature 1, and discard the feature 2, then all points will be projected to the x axis accordingly. Then we can get the following figure:


Similarly, if we choose feature 2 and discard the feature 1, then all points will be projected to the y axis.


So, up to now, we have two solutions for dimensionality reduction.


Left side, all points are projected in y-axis, which discards the feature 2. Right side, all points are projected in x-axis, which discards the feature 1. Now, let’s compare this two figures, which one is better ?
Obviously, we think the right side figure is better. So you may ask, WHY?
Because when we project the points in x-axis, the distance between different points are much larger, which indicates that it has higher degree of distinction. Also, the larger distance between points can better reflect the distance between the original sample points. However, the left side points are too dense, it differs greatly from the original points and their distribution, correspondingly.
So, if we want to choose one solution to reduce the dimension from 2 to 1, we obviously will choose the right side figure. Now there is one question:
Is this the BEST solution? Do we have better solution?


Then we can find that, if we choose this axis to project points, there is no big difference between the distribution of the projected points and the original points. In other words, the distance between the projected points are larger than projecting points to the x-axis or y-axis.
Then, our problem become how to find the axis that maximizes the distance between samples? In order to find the target axis, first, we need to define the distance between samples.
Using Variance.
The larger the variance, the more sparse the samples; and the smaller the variance, the closer the samples are.

Each sample points subtract its mean value, then sum the squares, and then divide it by total number.
Our problem now become, we want to find an axis so that all points are projected to this axis with the largest variance.
To deal with this problem, before we do PCA, first, the value of all sample points will be averaged. The distribution of the sample points has not changed. In fact, we just moved the coordinate axis. To make the sample points have mean value (equals 0) in each dimension.


Then, the variance can be simplified as follows:

Attention that, xi here are new sample points after projected to this axis. Since our example here is 2 dimension, the axis here can be written as (w1, w2).
So, what we call PCA, in summary:
- Demean all samples.
- Then we want to find the direction of the axis w=(w1, w2), to make all sample points projected in w, has the largest variance.


Assume the red line is the axis we want to find. Here, the Xi is also a vector, we use this red line to show the Xi vector. Then we project Xi in the w axis, we can get the Xproject. What we want to find is:
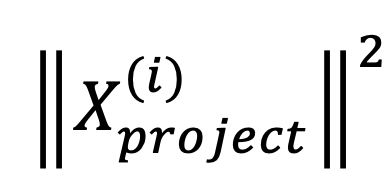
It’s actually the length of the blue line.
Actually, this kind of projection is the definition of dot product (two vectors do dot project A.B).
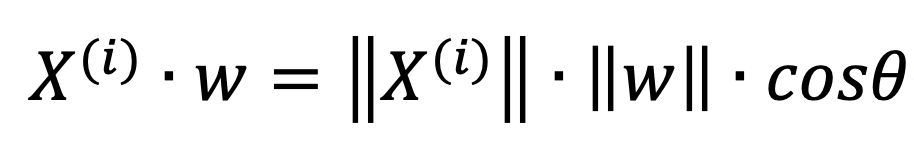
Here, we want to find the direction of w, w can be treated as a direction vector, so the ||w|| equals 1. Then we can derive:
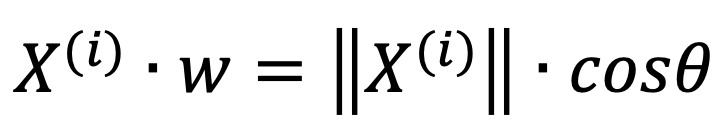
Here, ||X(i)|| is the length of vector Xi, when it multiplies cos(theta), it equals to the length of Xproject.
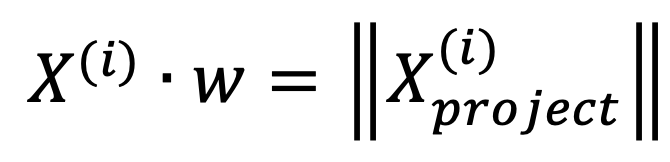
Then we can easily find that, the length of Xproject equals to: do dot product between the given sample points Xi and the w axis.
Then we can get the function as follows:

Hence, finally, our objective function is:
Find w, to maximize the:
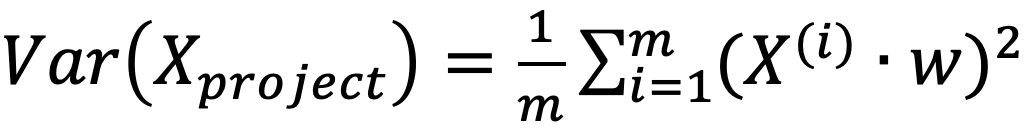
which also can be extended as follows


 6万+
6万+


 被折叠的 条评论
为什么被折叠?
被折叠的 条评论
为什么被折叠?
 到【灌水乐园】发言


