


 本文介绍了如何在Vue项目中安装并使用Echarts来创建折线图。首先通过npm安装Echarts,并在main.js中进行全局注册。然后通过示例展示了如何初始化图表实例、配置图表选项以及在组件挂载后渲染图表。
Echarts安装与使用(Vue)
一、安装echarts
npm install echarts --save
二、在main.js注册
// 导入echarts 图表
import echarts from 'echarts'
Vue.prototype.$echarts = echarts
若出现错误"export 'default' (imported as 'echarts') was not found in 'echarts',是引入版本号过高的原因
原因:版本过高
解决方法:
删除
npm uninstall echarts
重新安装低版本
npm install echarts@4.8.0 --save
三、使用
整体代码
<template>
<div class="chart" id="chart" style="height: 500px"></div>
</template>
<script>
export default {
methods: {
createChart() {
// 创建echarts实例
var myChart = this.$echarts.init(document.getElementById("chart"));
let option = {
// x轴
xAxis: {
// 一般情况 x轴都是 category
type: 'category',
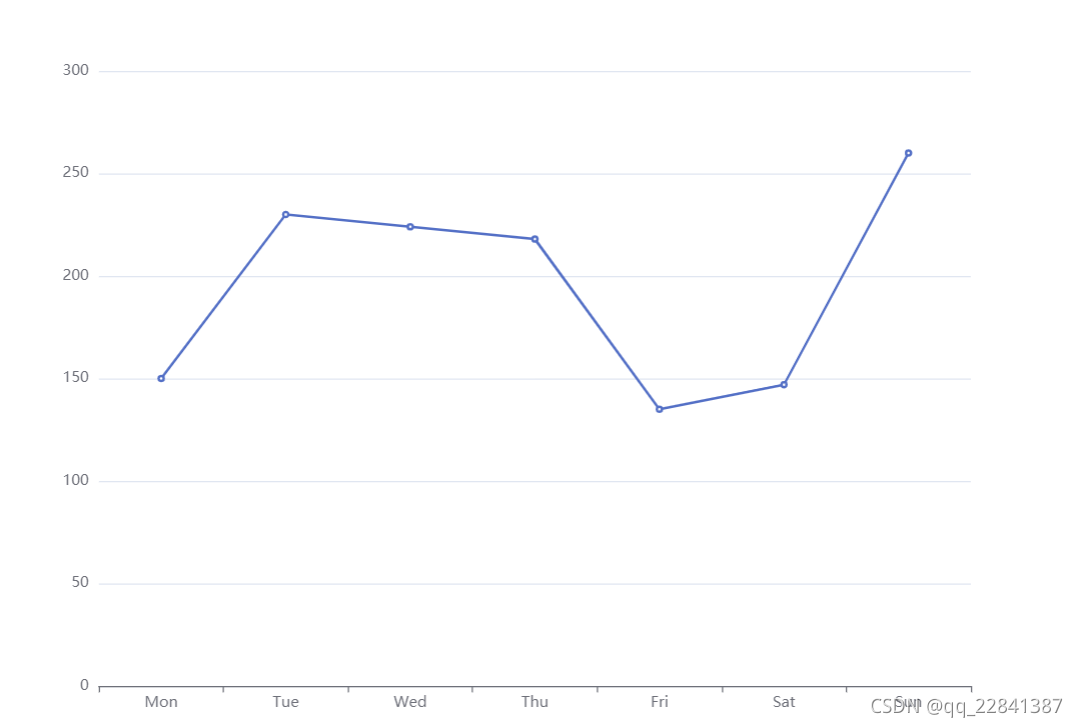
data: ['Mon', 'Tue', 'Wed', 'Thu', 'Fri', 'Sat', 'Sun']
},
// y 轴
yAxis: {
// 一般情况y轴也都是value型,数据来自series
type: 'value'
},
// 整个区域
series: [{
data: [150, 230, 224, 218, 135, 147, 260],
/**
line--折线图
bar--柱状图
*/
type: 'line'
}]
}
myChart.setOption(option);
},
mounted() {
this.$nextTick(() => {
this.createChart();
});
},
},
};
</script>
1.给个容器
<div class="chart" style="height: 500px"></div>
2.初始化echarts
①获取容器
var myChart = this.$echarts.init(document.querySelector(".chart"));
②填装内容
let option = {
    // x轴
    xAxis: {
        // 一般情况 x轴都是 category
        type: 'category',
        data: ['Mon', 'Tue', 'Wed', 'Thu', 'Fri', 'Sat', 'Sun']
    },
    // y 轴
    yAxis: {
        // 一般情况y轴也都是value型,数据来自series
        type: 'value'
    },
    // 整个区域
    series: [{
        data: [150, 230, 224, 218, 135, 147, 260],
        /**
        line--折线图
        bar--柱状图
        */
        type: 'line'

    }]
}
③设置
myChart.setOption(option);
④调用函数
mounted() {
    this.$nextTick(() => {
      this.initChart();
    });
  },
这里就完成了echarts中折线图的制作
echarts更多信息,请前往 echarts属性详解


 590
590

 被折叠的 条评论
为什么被折叠?
被折叠的 条评论
为什么被折叠?
 到【灌水乐园】发言


