


 超级会员免费看
很多时候,科研过程中,我们需要比较多个曲线的拟合情况,因此就需要将多条曲线放在一个坐标下面对比,这时候就需要用到Show[]函数
例1 绘制点集合和曲线
Show[Plot[x^2, {x, 0, 3.5}], ListPlot[{1, 4, 9}]]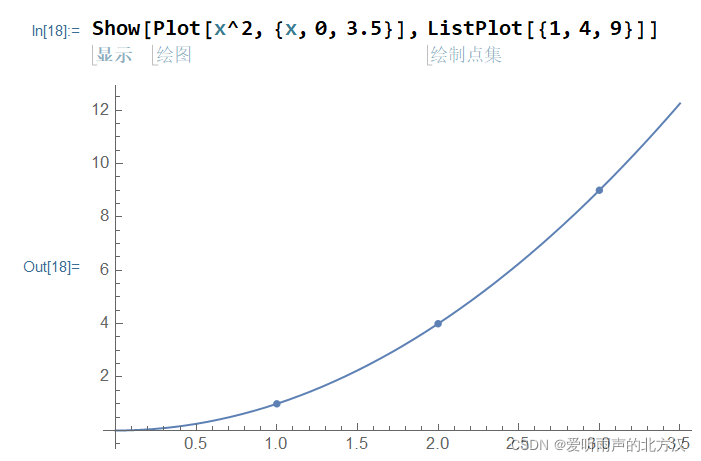
例2 绘制等高线图
Show[DensityPlot[Sin[x] Sin[y], {x, -3, 3}, {y, -3, 3}],
 ContourPlot[Sin[x] Sin[y], {x, -3, 3}, {y, -3, 3},
  ContourShading -> None]]
例3 绘制多条曲线在一个图中
Show[{PolarPlot[1 + 2 Sin[t/2], {t, 0, \[Pi]
 订阅专栏 解锁全文


 5964
5964


 被折叠的 条评论
为什么被折叠?
被折叠的 条评论
为什么被折叠?
 到【灌水乐园】发言


