


ggalluvial是一个基于ggplot2的扩展包,冲击图(alluvial diagram)是流程图(flow diagram)的一种,最初开发用于代表网络结构的时间变化。
R代码
# install.packages("ggalluvial")
library(ggalluvial)
help(package=ggalluvial)
### 1.加载数据
titanic_wide <- data.frame(Titanic)
colnames(titanic_wide) #[1] "Class" "Sex" "Age" "Survived" "Freq"
# 判断数据格式
is_alluvia_form(titanic_wide)
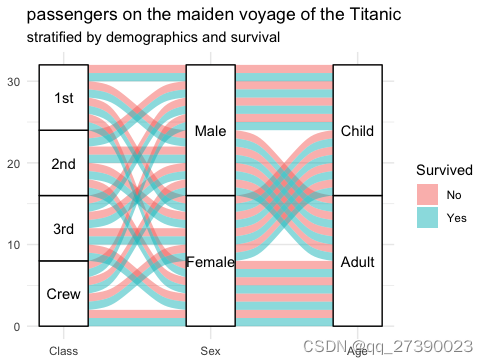
### 2. 绘制冲击图
# 绘制性别与舱位和年龄的关系
ggplot(data = titanic_wide,
aes(axis1 = Class, axis2 = Sex, axis3 = Age,
weight = Freq)) +
scale_x_discrete(limits = c("Class", "Sex", "Age"), expand = c(.1, .05)) +
geom_alluvium(aes(fill = Survived),width = 1/3) +
geom_stratum(width = 1/3, fill = "white", color = "black") +
geom_text(stat = "stratum",aes(label = after_stat(stratum))) +
theme_minimal() +
coord_flip() +
ggtitle("passengers on the maiden voyage of the Titanic",
"stratified by demographics and survival")
# 具体参考说明:data设置数据源,axis设置显示的柱,weight为数值,
# geom_alluvium为冲击图组间面积连接并按生存率比填充分组,
# geom_stratum()每种有柱状图,geom_text()显示柱状图中标签,
# theme_minimal()主题样式的一种,ggtitle()设置图标题
# coord_flip() 坐标轴翻转
### 3.更多示例代码
vignette(topic = "ggalluvial", package = "ggalluvial")参考:
https://cran.r-project.org/web/packages/ggalluvial/vignettes/ggalluvial.html
https://github.com/corybrunson/ggalluvial


 884
884

 被折叠的 条评论
为什么被折叠?
被折叠的 条评论
为什么被折叠?
 到【灌水乐园】发言


