


matplotlib绘图练习2——绘制菱形sin,星形cos
首先设置基本参数(linspace最初设置1000,结果整个图飘了,最后不断修改最后在50的时候完美了……)
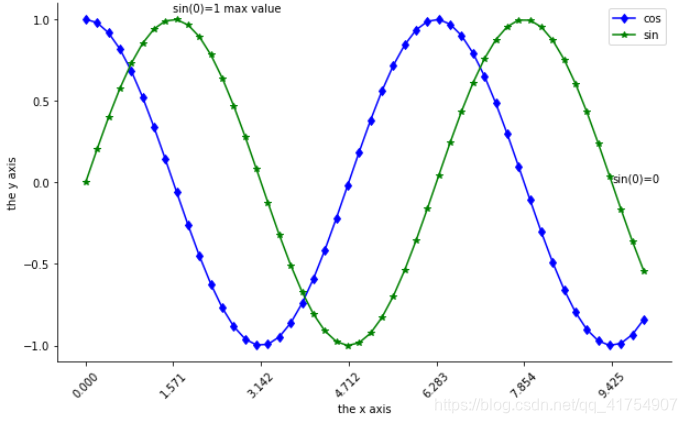
x = np.linspace(0, 10, 50)
y1 = np.sin(x)
y2 = np.cos(x)
画图:
plt.figure(figsize=(10, 6))
plt.plot(x, y2, 'bd-', ) # *为菱形
plt.plot(x, y1, 'g*-')   # d为星形

plt.xlabel('the x axis')
plt.ylabel('the y axis')

# rotation设置横坐标倾斜45度
plt.xticks([0, 0.5*np.pi, 1*np.pi, 1.5*np.pi, 2*np.pi, 2.5*np.pi, 3*np.pi], rotation=45)
plt.yticks([1.0, 0.5, 0.0, -0.5, -1.0])

# 标注点.annotate('文本内容', (x,y), xytext=(x,y))
# xytext文本坐标
plt.annotate('sin(0)=1 max value', (0,1), xytext=(0.5*np.pi, 1.05))
plt.annotate('sin(0)=0', (3*np.pi, 0), xytext=(3*np.pi, 0))

# 去掉右、上边框
ax = plt.gca()
ax.spines['right'].set_color('none')
ax.spines['top'].set_color('none')

plt.legend(['cos', 'sin'])
plt.show()


 3079
3079


 被折叠的 条评论
为什么被折叠?
被折叠的 条评论
为什么被折叠?
 到【灌水乐园】发言


