在Matplotlib中动态更新绘图的3种方法

本文展示了如何随着数据的变化动态更新Matplotlib(Python的数据可视化库)图。它提供了两种绘图方法-第一种是API(适用于大型程序或需要深度控制的程序),第二种是Pyplot接口(受Matlab启发)。在本文中,我们将展示如何在Pyplot环境中动态更新图。

使用Matplotlib Pyplot绘制线图

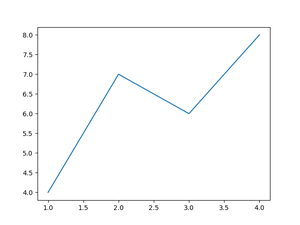
在创建一个动态更新的图之前,让我们首先使用Matplotlib创建/绘制一个简单的静态线图。此图稍后将升级为动态更新数据。下面是一个使用Matplotlib创建静态线图的程序。

import matplotlib.pyplot as plt

x = [1,2,3,4] # x-coordinates of the data points
y = [4,7,6,8] # y-coordinates of the data points

graph = plt.plot(x,y) # plotting the data and storing the graph in variable named graph
plt.show()			 # showing the resultant graph

在这里插入图片描述

在Matplotlib中动态更新绘图

1.使用matplotlib.animations

我们可以使用“matplotlib.animations.FuncAnimation”函数来更新绘图。

from matplotlib.animation import FuncAnimation
import matplotlib.pyplot as plt
import random

# initial data
x = [1]
y = [random.randint(1,10)]

# creating the first plot and frame
fig, ax = plt.subplots()
graph = ax.plot(x,y,color = 'g')[0]
plt.ylim(0,10)


# updates the data and graph
def update(frame):
	global graph

	# updating the data
	x.append(x[-1] + 1)
	y.append(random.randint(1,10))

	# creating a new graph or updating the graph
	graph.set_xdata(x)
	graph.set_ydata(y)
	plt.xlim(x[0], x[-1])

anim = FuncAnimation(fig, update, frames = None)
plt.show()

在这里插入图片描述
2.使用pyplot交互模式更新Matplotlib图

默认情况下,交互模式是关闭的,因此只有在调用show函数时才会绘制绘图。此外,在show函数处停止执行,直到图形关闭。然而,我们可以通过调用函数.ion()来打开交互模式。当交互模式打开时,图形会立即绘制,并在我们对其进行任何更改时立即更新。我们可以使用此行为使用以下方法动态更新绘图

import matplotlib.pyplot as plt
import random

plt.ion() # turning interactive mode on

# preparing the data
y = [random.randint(1,10) for i in range(20)]
x = [*range(1,21)]

# plotting the first frame
graph = plt.plot(x,y)[0]
plt.ylim(0,10)
plt.pause(1)

# the update loop
while(True):
	# updating the data
	y.append(random.randint(1,10))
	x.append(x[-1]+1)
	
	# removing the older graph
	graph.remove()
	
	# plotting newer graph
	graph = plt.plot(x,y,color = 'g')[0]
	plt.xlim(x[0], x[-1])
	
	# calling pause function for 0.25 seconds
	plt.pause(0.25)

在这里插入图片描述
3.Matplotlib更新散点图的示例

在这个例子中,我们使用“Figure.canvas.draw()”函数更新matplotlib散点图。

import matplotlib.pyplot as plt
from matplotlib.animation import FuncAnimation
import random

# initial data
x = [random.randint(1,100)]
y = [random.randint(1,100)]

# creating the figure and axes object
fig, ax = plt.subplots()

# update function to update data and plot
def update(frame):
	# updating the data by adding one more point
	x.append(random.randint(1,100))
	y.append(random.randint(1,100))

	ax.clear() # clearing the axes
	ax.scatter(x,y, s = y, c = 'b', alpha = 0.5) # creating new scatter chart with updated data
	fig.canvas.draw() # forcing the artist to redraw itself

anim = FuncAnimation(fig, update)
plt.show()

在这里插入图片描述

总结

至少有3种方法可以在matplotlib中完成动态更新绘图的任务。首先使用matplotlib.animations的FuncAnimation函数,其中定义了更新函数,该函数在每帧更新数据和图形,其次使用matplotlib交互模式,该模式通过创建更新数据的更新循环来利用图像在交互模式中即时更新的事实,并在每个周期更新图形,最后使用“figure.canvas.draw()”方法在每次更新后强制当前轴的更新后重新绘制图形。

  • 3
    点赞
  • 8
    收藏
    觉得还不错? 一键收藏
  • 0
    评论
你可以使用以下代码来实现动态更新图表: ```python import time import matplotlib.pyplot as plt import numpy as np from numpy.random import rand if __name__ == '__main__': # 启用交互模式 plt.ion() # 创建一个图形和一组子图 figure, ax = plt.subplots() # 使用lines保存绘图对象 lines, = ax.plot([], []) ax.set_autoscaley_on(True) ax.grid() for n in range(600): # 生成数据 xdata = np.arange(128) ydata = rand(128) # 更新数据 lines.set_xdata(xdata) lines.set_ydata(ydata) # 重新缩放 ax.relim() ax.autoscale_view() # 绘制并刷新图形 figure.canvas.draw() figure.canvas.flush_events() time.sleep(0.01) ``` 这段代码使用matplotlib库实现了动态绘图的功能。首先启用交互模式,并创建一个图形对象和子图对象。然后,通过循环生成随机数据,并更新图表数据。最后,绘制并刷新图形,以实现动态更新图表的效果。你可以根据需要调整数据生成和更新的逻辑,以满足你的需求。<span class="em">1</span><span class="em">2</span><span class="em">3</span> #### 引用[.reference_title] - *1* *2* [matplotlib 动态刷新绘图(最简单的方法)](https://blog.csdn.net/falwat/article/details/123306390)[target="_blank" data-report-click={"spm":"1018.2226.3001.9630","extra":{"utm_source":"vip_chatgpt_common_search_pc_result","utm_medium":"distribute.pc_search_result.none-task-cask-2~all~insert_cask~default-1-null.142^v92^chatsearchT3_1"}}] [.reference_item style="max-width: 50%"] - *3* [jupyter notebook 实现matplotlib动态刷新](https://download.csdn.net/download/weixin_38644141/14910441)[target="_blank" data-report-click={"spm":"1018.2226.3001.9630","extra":{"utm_source":"vip_chatgpt_common_search_pc_result","utm_medium":"distribute.pc_search_result.none-task-cask-2~all~insert_cask~default-1-null.142^v92^chatsearchT3_1"}}] [.reference_item style="max-width: 50%"] [ .reference_list ]

“相关推荐”对你有帮助么?

  • 非常没帮助
  • 没帮助
  • 一般
  • 有帮助
  • 非常有帮助
提交
评论
添加红包

请填写红包祝福语或标题

红包个数最小为10个

红包金额最低5元

当前余额3.43前往充值 >
需支付:10.00
成就一亿技术人!
领取后你会自动成为博主和红包主的粉丝 规则
hope_wisdom
发出的红包
实付
使用余额支付
点击重新获取
扫码支付
钱包余额 0

抵扣说明:

1.余额是钱包充值的虚拟货币,按照1:1的比例进行支付金额的抵扣。
2.余额无法直接购买下载,可以购买VIP、付费专栏及课程。

余额充值