


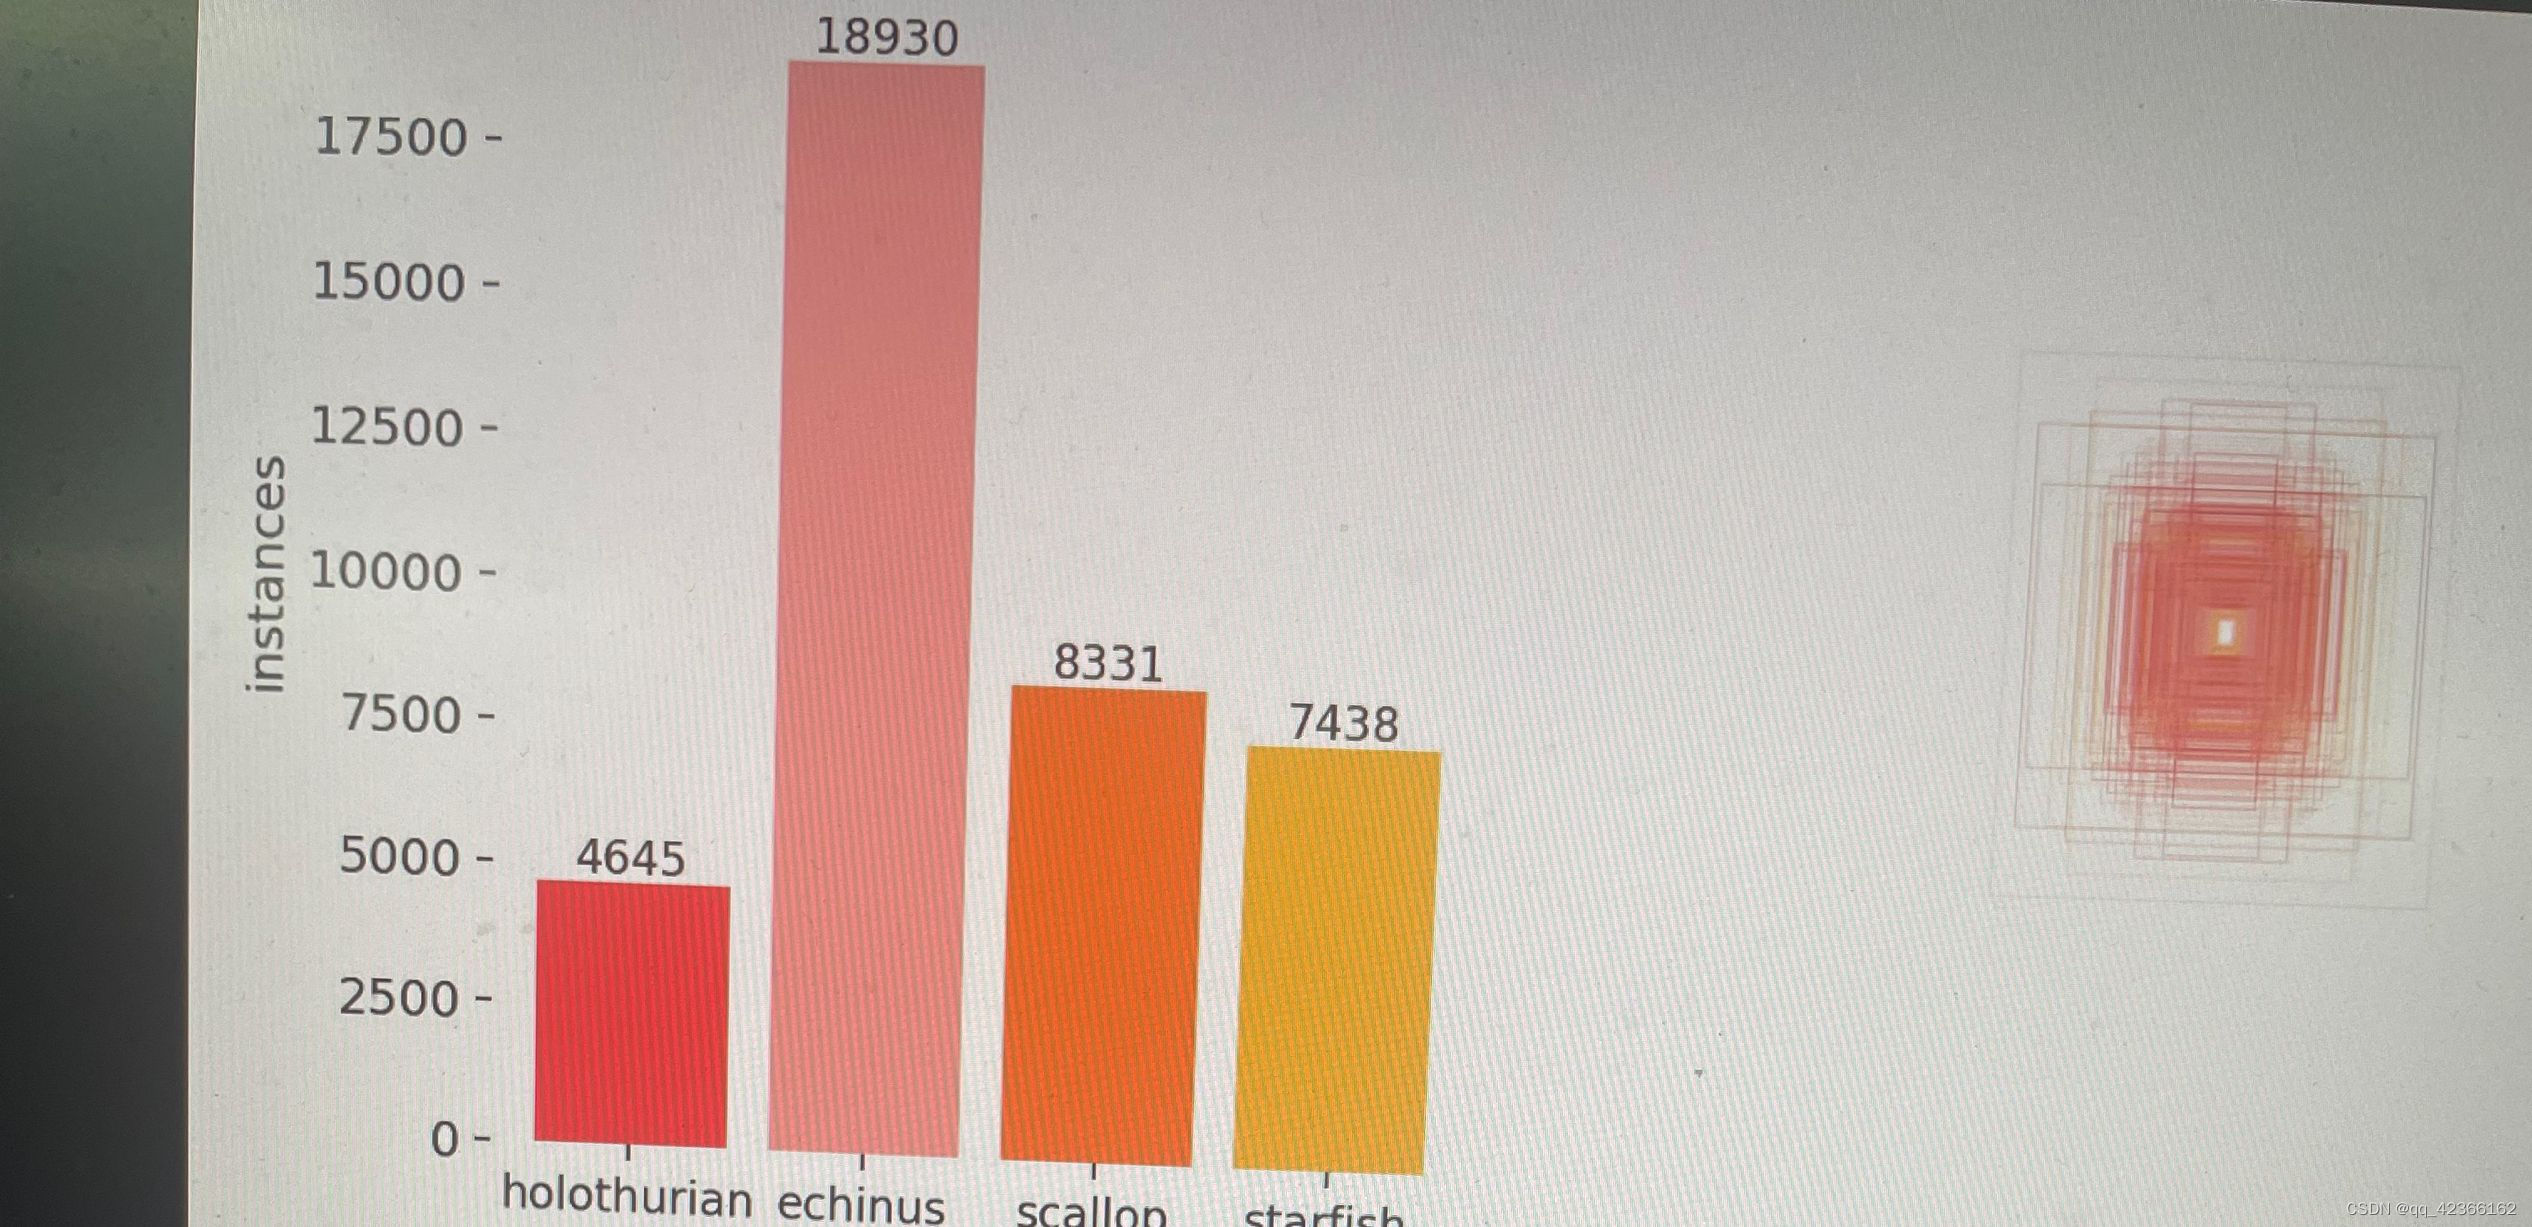
yolov5 lables.jpg 添加每个类别具体标签数量
lables.jpg在runs/train/exp中,但是没有具体的标签数量
用下面的代码去替换utils文件中的plots.py文件中的plot_labels类
def plot_labels(labels, names=(), save_dir=Path('')):
    # plot dataset labels
    LOGGER.info(f"Plotting labels to {save_dir / 'labels.jpg'}... ")
    x = np.array(labels)
    print("总实例数:", x.shape[0])
    c, b = labels[:, 0], labels[:, 1:].transpose()  # classes, boxes
    nc = int(c.max() + 1)  # number of classes
    x = pd.DataFrame(b.transpose(), columns=['x', 'y', 'width', 'height'])

    # seaborn correlogram
    sn.pairplot(x, corner=True, diag_kind='auto', kind='hist', diag_kws=dict(bins=50), plot_kws=dict(pmax=0.9))
    plt.savefig(save_dir / 'labels_correlogram.jpg', dpi=200)
    plt.close()

    # matplotlib labels
    matplotlib.use('svg')  # faster
    ax = plt.subplots(2, 2, figsize=(8, 8), tight_layout=True)[1].ravel()
    y = ax[0].hist(c, bins=np.linspace(0, nc, nc + 1) - 0.5, rwidth=0.8)
    print(y)
    try:  # color histogram bars by class
        [y[2].patches[i].set_color([x / 255 for x in colors(i)]) for i in range(nc)]  # known issue #3195
    except Exception:
        pass

    # Add label counts on top of the bars
    for i in range(nc):
        count = y[0][i]
        ax[0].text(i, count + 1, f'{count:.0f}', ha='center', va='bottom', fontsize=10)

    ax[0].set_ylabel('instances')
    if 0 < len(names) < 30:
        ax[0].set_xticks(range(len(names)))
        ax[0].set_xticklabels(names, rotation=0, fontsize=10)
    else:
        ax[0].set_xlabel('classes')
    sn.histplot(x, x='x', y='y', ax=ax[2], bins=50, pmax=0.9)
    sn.histplot(x, x='width', y='height', ax=ax[3], bins=50, pmax=0.9)

    # rectangles
    labels[:, 1:3] = 0.5  # center
    labels[:, 1:] = xywh2xyxy(labels[:, 1:]) * 2000
    img = Image.fromarray(np.ones((2000, 2000, 3), dtype=np.uint8) * 255)
    for cls, *box in labels[:1000]:
        ImageDraw.Draw(img).rectangle(box, width=1, outline=colors(cls))  # plot
    ax[1].imshow(img)
    ax[1].axis('off')

    for a in [0, 1, 2, 3]:
        for s in ['top', 'right', 'left', 'bottom']:
            ax[a].spines[s].set_visible(False)

    plt.savefig(save_dir / 'labels.jpg', dpi=200)
    matplotlib.use('Agg')
    plt.close()


 738
738


 被折叠的 条评论
为什么被折叠?
被折叠的 条评论
为什么被折叠?
 到【灌水乐园】发言


