


忽视的细节
语法系列
字符串系列
-
‘is’ and ’= = ‘ 的区别
由于数字驻留机制,数字的赋值内容使用is进行比对,返回的值是 true,若赋值内容不是单纯数字,那么就是返回false
i从整体来说,s 考虑的是地址,而==比较的是value -
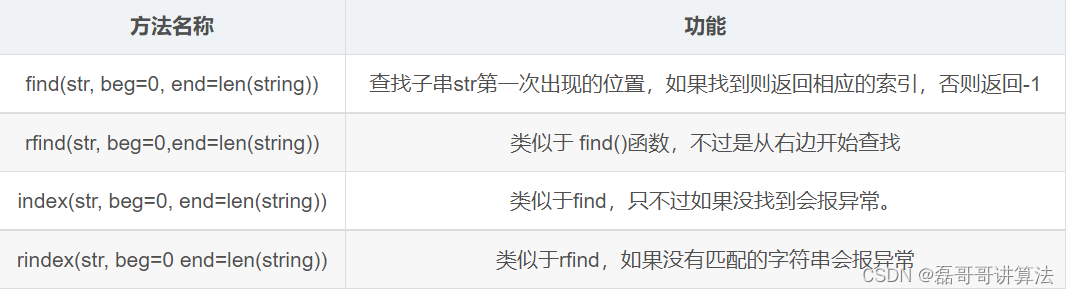
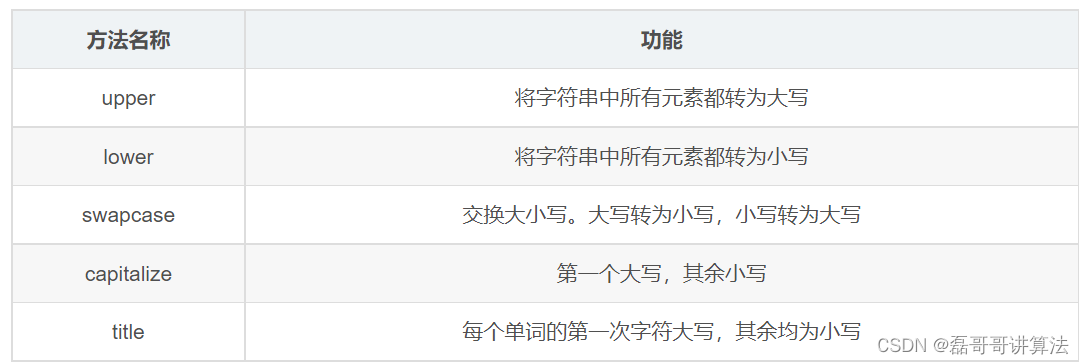
字符串 查询转换对齐

-
重点分割字符串
split(seq=“”, num=string.count(str)) 以空格分隔符截取字符串,如果有指定的值,那么就仅截取num+1个子字符串seq分割, rsplit是反向截取
partition(str) 找到字符串中第一个str,并以str为界,将字符串分割为3部分,返回一个新的tuple,str 的左边和本身以及它的右侧,rpartition反向寻找栈
str = "my name is qlee, what is your name"
print(str.split())       # 以空格为分隔符
print(str.split('i',1))   # 以 i 为分隔符
print(str.split('b'))     # 以b为分隔符,没找到不会报错
print(str.partition("name"))#找到第一个name,分割为三部分
print(str.rpartition("name"))#反向找到第一个name,分割为三部分

str = """my name is qlee
      what is your name"""
print(str.splitlines())
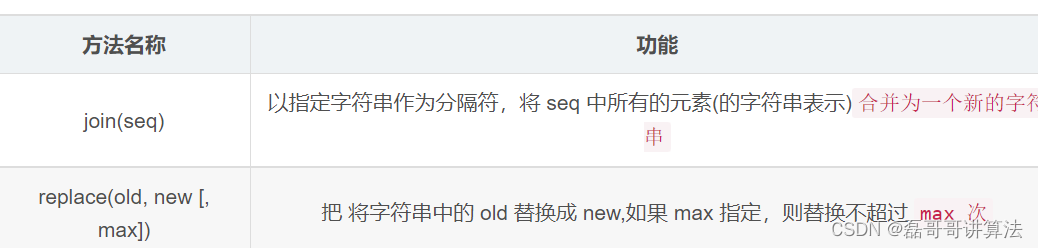
- 常见字符串函数
count(sub, start= 0,end=len(string)) 在字符串start,end的范围内,计算sub字符串中的个数
长度len属于内置函数,计算字符串中的字符个数
str = "my name is qlee, what is your name?"
print(str.count("name")) #2
print(len(str))# 35
- 解码 预防乱码梗
encode(encoding=‘UTF-8’,errors=‘strict’)
# 以 encoding 指定的编码格式编码字符串,如果出错默认报一个ValueError 的异常,除非 errors 指定的是’ignore’或者’replace’
bytes.decode(encoding=“utf-8”, errors=“strict”)
#Python3 中没有 decode 方法,但我们可以使用 bytes 对象的 decode() 方法来解码给定的 bytes 对象,这个 bytes 对象可以由 str.encode() 来编码返回

import requests
url='http://www.netbian.com/s/xingganmeinv/index.htm'
#解析包
from lxml import etree

resp=requests.get(url,headers={'User-Agent': 'Mozilla/5.0 (Windows NT 10.0; Win64; x64) AppleWebKit/537.36 +\
             (KHTML, like Gecko) Chrome/101.0.4951.64 Safari/537.36'})
resp.encoding="gbk"//重点的编码,从网页上爬取的话不同的编译会出现bug,需要整体修改一下能变成咱们能看懂的
//常见的编码有utf—8 和gbk,这俩比较关键
print(resp.text)
print(resp.text) #打印结果
列表系列
- 列表函数
append 增加函数,将增加数据放置于尾部 ,不需要额外加新的变量,用于list后面加元素
extend 将另一个列表的元素加到list的尾部 ,将其他列表或元组中的元素导入到当前列表中
insert 讲一个元素添加到当前列表的指定位置上 list.insert(index, new_iitem) 若inset传入的位置不存在,则将新元素添加到列表末尾
remove 删除元素 pop(index)删除并返回列表list指定为止index的元素,clear清除 del指定删除
index 访问索引位置 count计数出现的次数 len长度
[::负数]就是倒序排列了
排序系列
排序sort sort(reverse=true)shuffle
tuple系列
()是创建元组,小括号可以省略,逗号很关键用来区分的
元组tuple可以接受列表、字符串、其他序列类型、迭代器等生成元祖
zip(list)多个列表对应位置元素,可以包装在一起用
生成器系列
生成器只可以使用一次,s=(x*2 for x in range(5)) tuple(s)里面的资源也只能用一次 s.next()
dict字典系列
字典是键值对 无序可变的序列 定义方式 a={‘name’:东西’age’:} fromkeys是空键
update更新操作
del clear pop删对象并返回值 popitem随机一个受害者
字典的本质就是表格,核心是散列表,数组每单元叫做bucket key 对应value
set系列
集合对象 键是不能重复的{}
set将列表变成集合
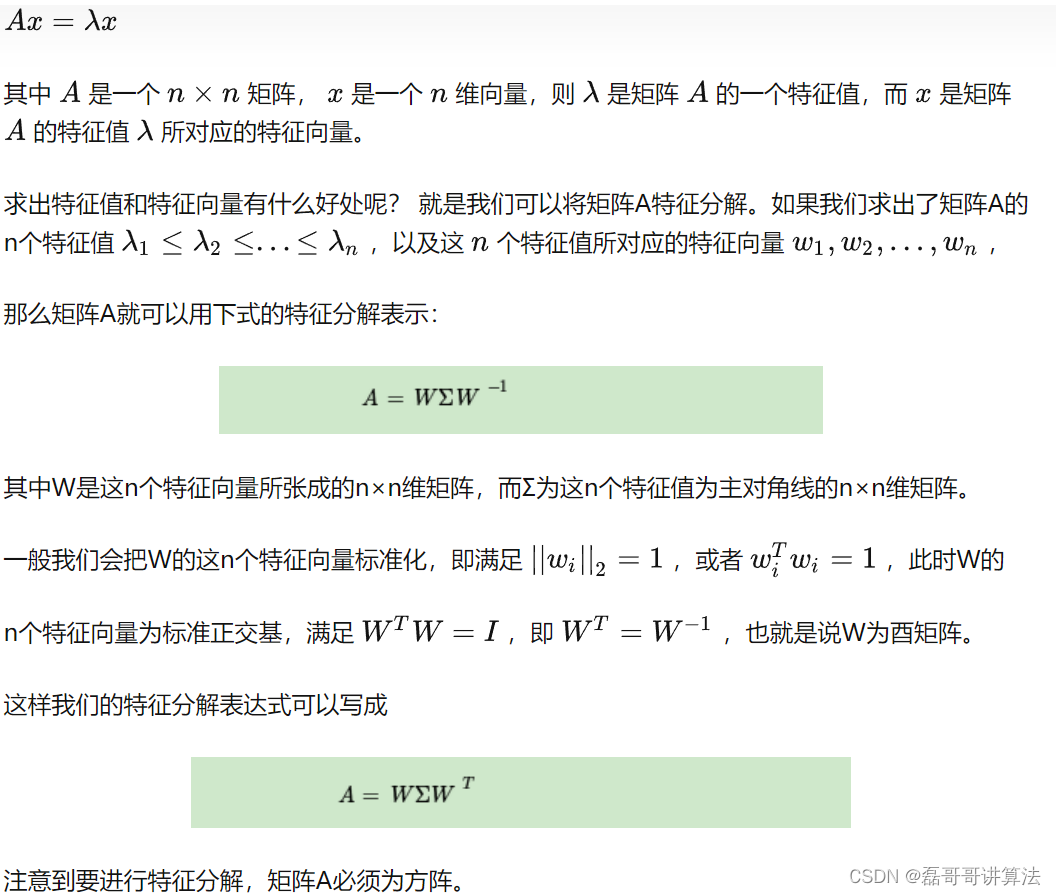
机器学习实战python基于SVD奇异值分解进行矩阵分解
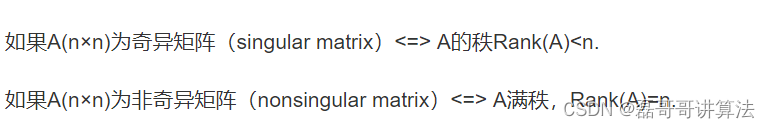
奇异值分解
奇异值分解(Singular Value Decomposition,SVD)是一种重要的矩阵分解技术,它可以将一个矩阵分解为三个矩阵的乘积,分别为左奇异矩阵、奇异值矩阵和右奇异矩阵。SVD 的原理可以描述如下:(线性代数)
SVD官方解释
算法的优缺点
优点:
- SVD 可以处理非方阵和稠密矩阵,这是其他矩阵分解方法(如LU分解和QR分解)无法处理的情况。
- SVD 可以有效地进行降维,保留最重要的特征,从而可以在不影响模型性能的情况下减少特征数量。
- SVD 分解得到的三个矩阵可以分别表示原矩阵在行空间、列空间和主对角线方向的信息,有助于对矩阵的性质和特征进行分析。
缺点: - SVD 运算时间复杂度较高,在处理大型矩阵时需要大量的计算资源。
- SVD 分解后得到的矩阵可能存在精度问题,特别是对于非常接近零的奇异值。
- SVD 分解的结果可能存在多解的情况,这需要根据实际问题和领域知识进行进一步的分析和处理。
用矩阵分割数刻画出一个图片
用我璇姐的图片,可以存到本地,你也可以申请抓取都可以
import numpy as np
import cv2
image=cv2.imread('czx.jpg')
print(image)
print(type(image))
print(image.shape)
from PIL import Image
if __name__=='__main__':
    image_file='wbb.jpg'
    width=100
    img=Image.open(image_file)
    img_width,img_height=img.size
    height=int(1.8*width*img_height//img_width)
    img=img.resize((width,height),Image.ANTIALIAS)
    pixels=np.array(img.convert('L')) //图片切割和画布转换
    print('type(pixels)=',type(pixels))
    print(pixels.shape)
    print(pixels)
    chars="MNHQ54:-;."//文字填充
    N=len(chars)
    step=256//N
    result=''
    for i in range(height):
        for j in range(width):
            result+=chars[pixels[i][j]//step]
        result+='\n'
    with open('test01.txt',mode='w')as f:
        f.write((result))
效果图

图片合成
图片流获取
import requests
url='http://www.netbian.com/s/xingganmeinv/index.htm'
#解析包 主要是在网页检查源文件,在申请访问中跳门板
from lxml import etree
resp=requests.get(url,headers={'User-Agent': 'Mozilla/5.0 (Windows NT 10.0; Win64; x64) AppleWebKit/537.36 +\
(KHTML, like Gecko) Chrome/101.0.4951.64 Safari/537.36'})
resp.encoding="gbk"
print(resp.text)
print(resp.text) #打印结果
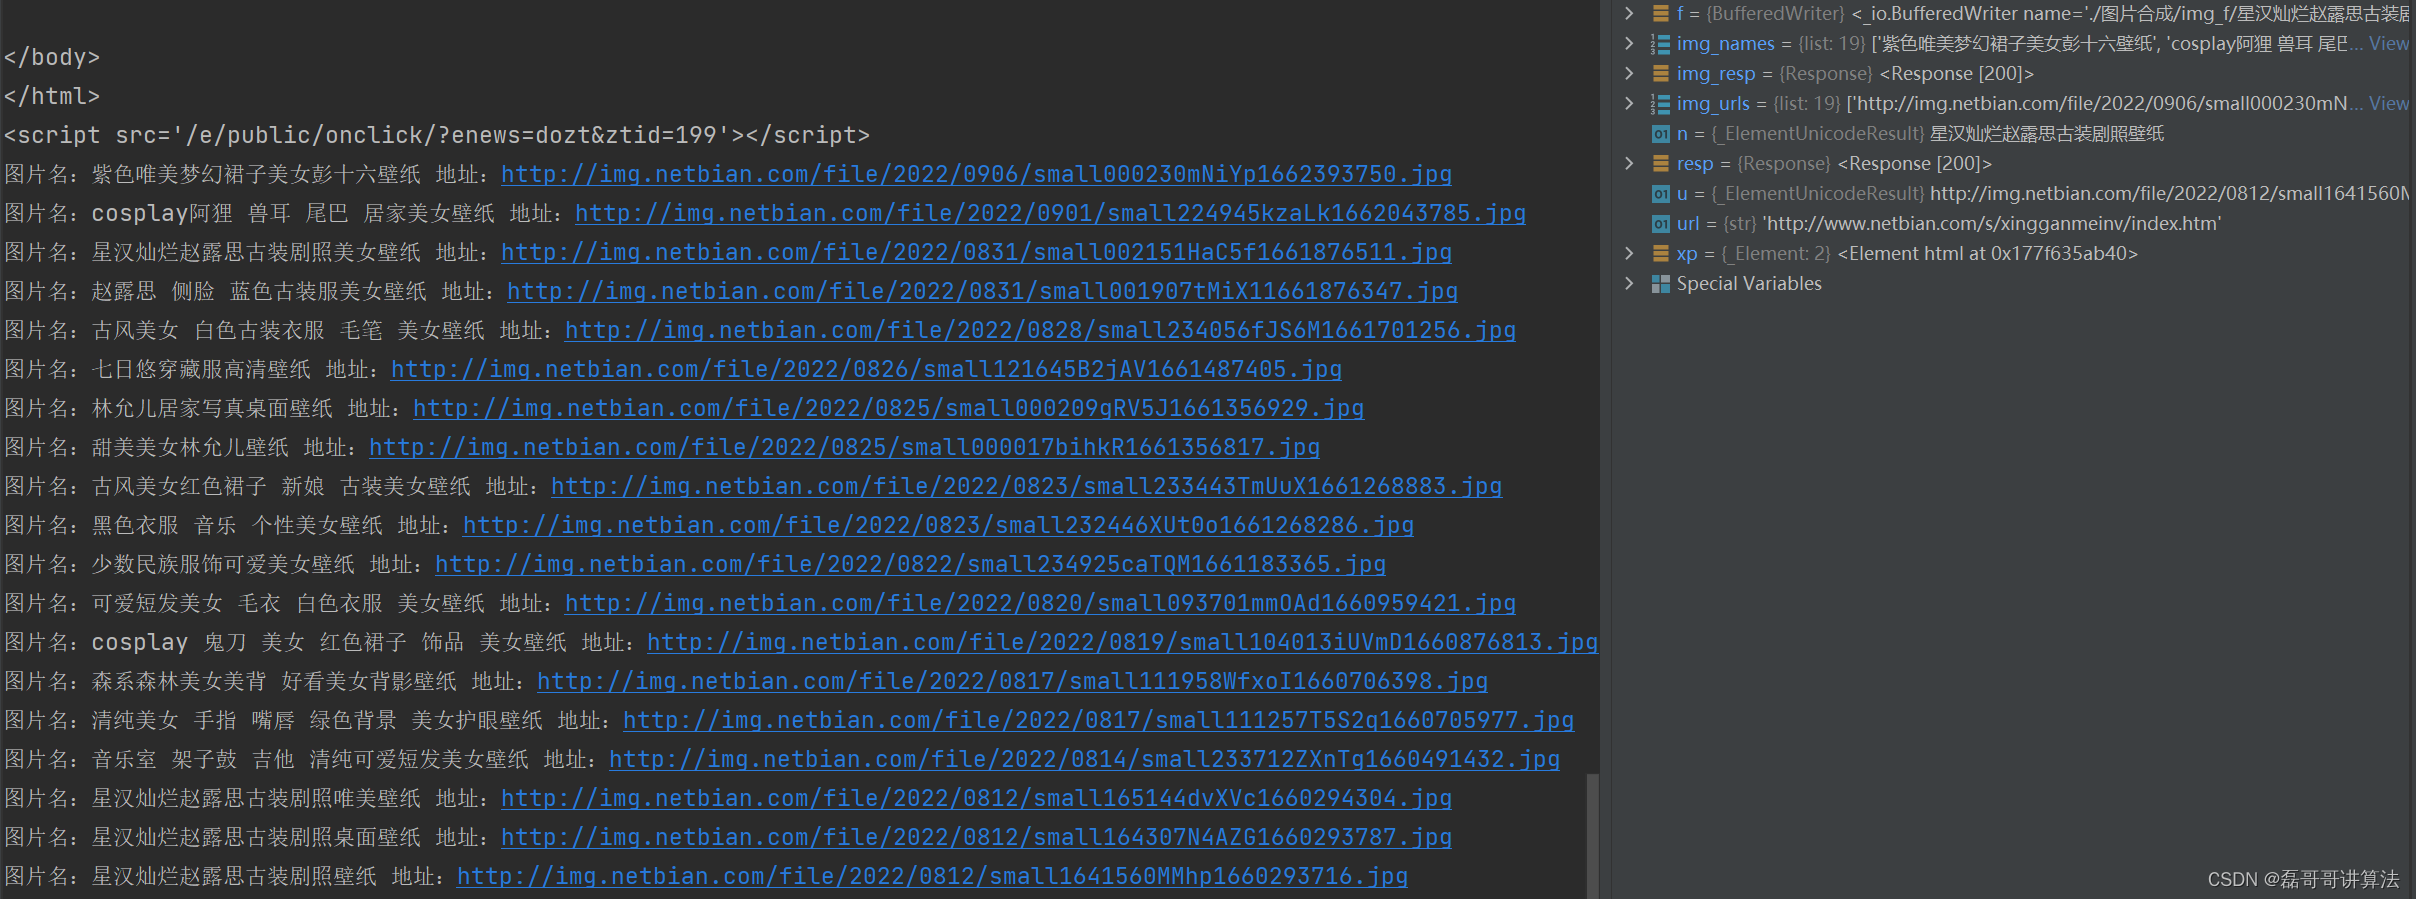
xp=etree.HTML(resp.text)// 利用xpath这个插件,直接省略读取出页面里的资源地址
img_urls=xp.xpath('//ul/li/a/img/@src')
img_names=xp.xpath('//ul/li/a/img/@alt')
for u,n in zip(img_urls,img_names):
print(f'图片名:{n} 地址:{u}')
img_resp=requests.get(u,headers={'User-Agent': 'Mozilla/5.0 (Windows NT 10.0; Win64; x64) AppleWebKit/537.36 +\
(KHTML, like Gecko) Chrome/101.0.4951.64 Safari/537.36'})
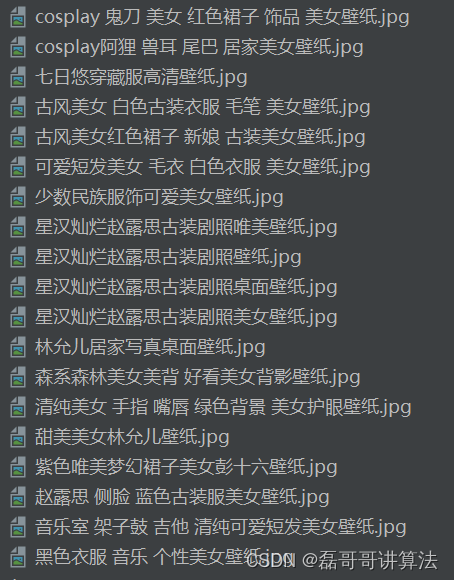
with open(f'./图片合成/img_f/{n}.jpg','wb')as f:
f.write(img_resp.content)
执行效果图,抓取图片的实现,注意流和中文化
图片合成排版
# import pillow
from PIL import  Image
im=Image.open('./图片合成/img_f/七日悠穿藏服高清壁纸.jpg')
w,h=im.size
image_row=4
image_column=4
import os
names=os.listdir('./图片合成/img_f')//合成读取排版
new_img=Image.new('RGB',(image_column*w,image_row*h))
for y in range(image_row):
    for x in range(image_column):
        o_image=Image.open('./图片合成/img_f/'+names[image_column*y+x])
        new_img.paste(o_image,(x*w,y*h))//矩阵存放
new_img.save('new_img55555.jpg')
找到本地的下载路劲然后按照矩阵拼接在画布newimage上进行放置

引入plot可视化库
在使用Python进行数据可视化编程中matplotlib库是我们用来对数据进行画图常用的第三方库。其中含有各类函数也就是不同类型的图形,要使用matplotlib库中的函数就需要了解函数所需要数据的格式,这也是我们学习matplotlib库的重点。
直接使用plot()函数画图,是对于一般的简单数据。我们可以采用直接调用plot()函数对列表数据进行直接画图。初期学习直接使用plot()函数能便于我们对后面图形学习奠定函数的参数及基础。
plt.plot(x, y, fmt='xxx', linestyle=, marker=, color=, linewidth=, markersize=, label=, )
figure画布 axes坐标系 axis坐标轴,默认先有的是y,然后是x,图形不同图形有不同的函数代称
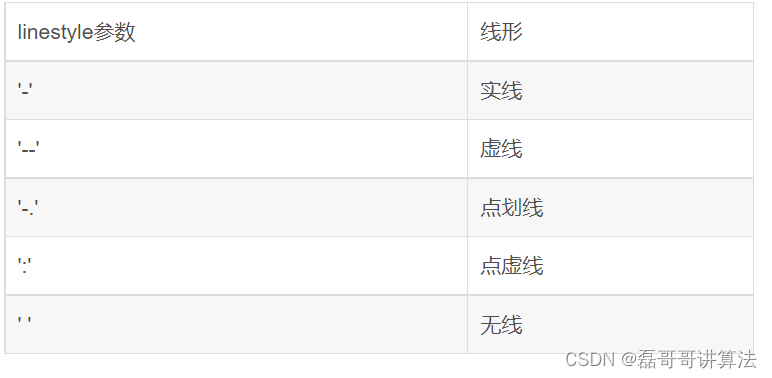
(1) linestyle:此字段是线的样式,参数形式:字符串,linewidth是指线的粗细
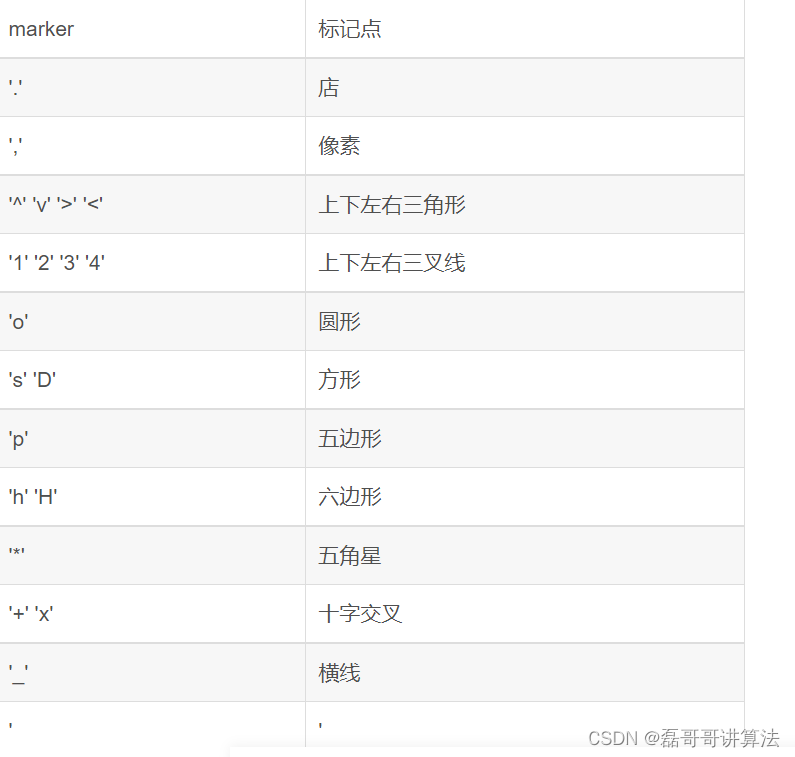
(2)marker:点的样式 markersize大小
(3)color颜色基本都是首字母小写
plot函数基本使用
import matplotlib.pyplot as plt
plt.plot()
# 导入包
import matplotlib.pyplot as plt
import numpy as np
# 构造数据
# 位置 (2维:x,y一一对应)
x = np.linspace(0, 2 * np.pi, 200)  # 从0到2pi的200个值
y = np.sin(x)                       # 从sin(0)到sin(2pi)的200个值
# 颜色(0维)
c = 'red'
c = 'r'
c = '#FF0000'
# 大小(0维): 线宽
lw = 1

# 生成一个Figure画布和一个Axes坐标系
fig, ax = plt.subplots()
# 在生成的坐标系下画折线图
ax.plot(x, y, c, linewidth=lw)
# 显示图形
plt.show()
多条轨迹交错
#导入包
import matplotlib.pyplot as plt
import numpy as np
import pandas as pd

#使用linspace()方法构成数据
x = np.linspace(0, 2 * np.pi, 50)  #
y1 = np.sin(x)
y2 = np.cos(x)
#转化数据形式
df = pd.DataFrame([x,y1,y2]).T
#对列重新命名
df.columns = ['x','sin(x)','cos(x)']
#数据写入图像,命名图例
plt.plot(df['x'],df['sin(x)'],label='sin(x)')
plt.plot(df['x'],df['cos(x)'],label='cos(x)')
plt.legend()
我们通过numpy的linspace方法生成数据再通过pandas对数据进行DataFrame化再带入plot()函数,此处需要讲的就是图例的命名方法,通过在函数中写入label参数,确定图例的标签,再通过legend()函数生成图例。
展示一个比较全面的画布图像
import matplotlib.pyplot as plt
import pandas as pd
datafile = r'world_population.txt'  # 打开文件
df = pd.read_csv(datafile)  #读取数据
df.head()#展示前面部分数据
# 设置中文字体
plt.rcParams['axes.unicode_minus'] = False    # 不使用中文减号
plt.rcParams['font.sans-serif'] = 'FangSong'  # 设置字体为仿宋(FangSong)

# 画布
fig = plt.figure(figsize=(6,4),  # inches
                 dpi=120, # dot-per-inch
                 facecolor='#BBBBBB',
                 frameon=True, # 画布边框
                )
plt.plot(df['year'],df['population'],'b:o',label='人口数')

# 中文标题
plt.title("1960-2009 世界人口")

# 字体字典
font_dict=dict(fontsize=8,
              color='k',
              family='SimHei',
              weight='light',
              style='italic',
              )

# X轴标签
plt.xlabel("年份", loc='center', fontdict=font_dict)   # loc: 左中右 left center right

# Y轴标签
plt.ylabel("人口数",loc='top', fontdict=font_dict)  # loc: 上中下 top center bottom

# X轴范围
plt.xlim((2000,2010))  # X轴的起点和终点

# Y轴范围
plt.ylim(6e9,7e9) # Y轴的起点和终点

# X轴刻度
plt.xticks(np.arange(2000,2011))

# X轴刻度
plt.yticks(np.arange(6e9,7e9+1e8,1e8))

# 图例
plt.legend()
# plt.legend(labels=['人口'])

# 网格线
plt.grid(axis='y')  # axis: 'both','x','y'


 453
453


 被折叠的 条评论
为什么被折叠?
被折叠的 条评论
为什么被折叠?
 到【灌水乐园】发言


