


# -*- coding: utf-8 -*-
import os
from collections import Counter
from PIL import Image
import numpy as np
import matplotlib.pyplot as plt

# NYUv2数据集中标签的类别编号及名称
class_labels = {
    0:  'void',
    1:    'wall',
    2:    'floor',
    3:    'cabinet',
    4:    'bed',
    5:    'chair',
    6:    'sofa',
    7:   'table',
    8:    'door',
    9:    'window',
    10:    'bookshelf',
    11:    'picture',
    12:    'counter',
    13:   'blinds',
    14:    'desk',
    15:    'shelves',
    16:    'curtain',
    17:    'dresser',
    18:    'pillow',
    19:    'mirror',
    20:    'floor mat',
    21:    'clothes',
    22:    'ceiling',
    23:    'books',
    24:    'refridgerator',
    25:    'television',
    26:    'paper',
    27:    'towel',
    28:    'shower curtain',
    29:    'box',
    30:    'whiteboard',
    31:    'person',
    32:    'night stand',
    33:    'toilet',
    34:    'sink',
    35:    'lamp',
    36:    'bathtub',
    37:    'bag',
    38:    'otherstructure',
    39:    'otherfurniture',
    40:    'otherprop'
}

# NYUv2数据集中所有标签所在的文件夹路径
label_dir = "C:/Users/翰墨大人/Desktop/ESANet-main/datasets/train/labels_40"

# 使用Counter计算每个类别出现的次数
counts = Counter()
counts_per_class = 0
for filename in os.listdir(label_dir):
    if filename.endswith('.png'):
        label_path = os.path.join(label_dir, filename)
        label = Image.open(label_path)
        label_array = np.array(label)

        unique = np.unique(label_array)
        def counter(arr):
            return Counter(arr)


        counts.update(counter(unique))
# 打印结果
print(counts)

fig, ax = plt.subplots(figsize=(12, 8))
ax.bar(counts.keys(), counts.values())
ax.set_xlabel('Label')
ax.set_ylabel('Number of Occurrences')
ax.set_title('NYUv2 Dataset Class Distribution')
plt.xticks(list(class_labels.keys()), list(class_labels.values()), rotation=90)
plt.show()
1:注意标签的顺序
2:统计的是类别出现的次数,而不是类别像素的个数
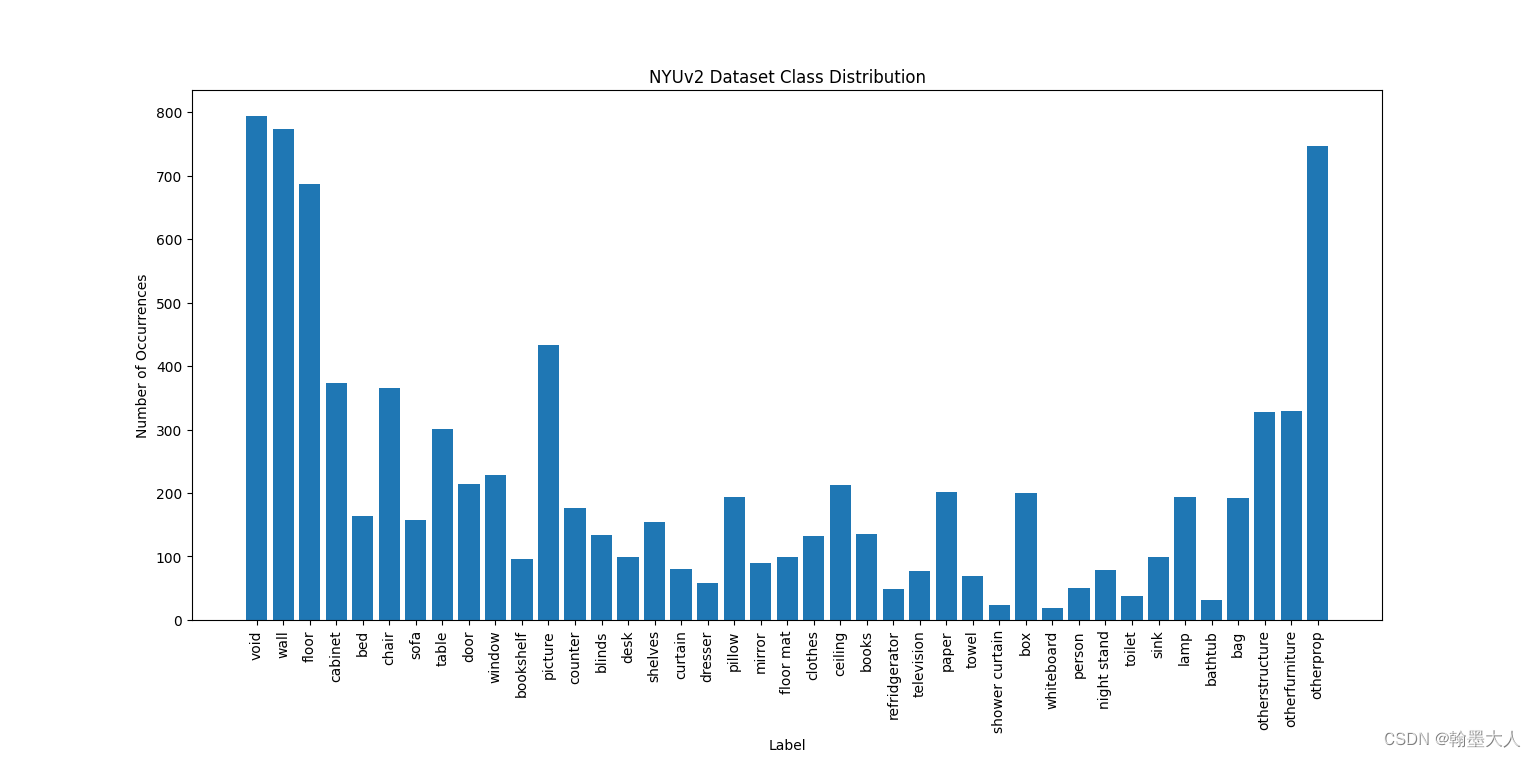
3:载入训练集的图片共795张,结果如下,修改根目录可切换到验证集。

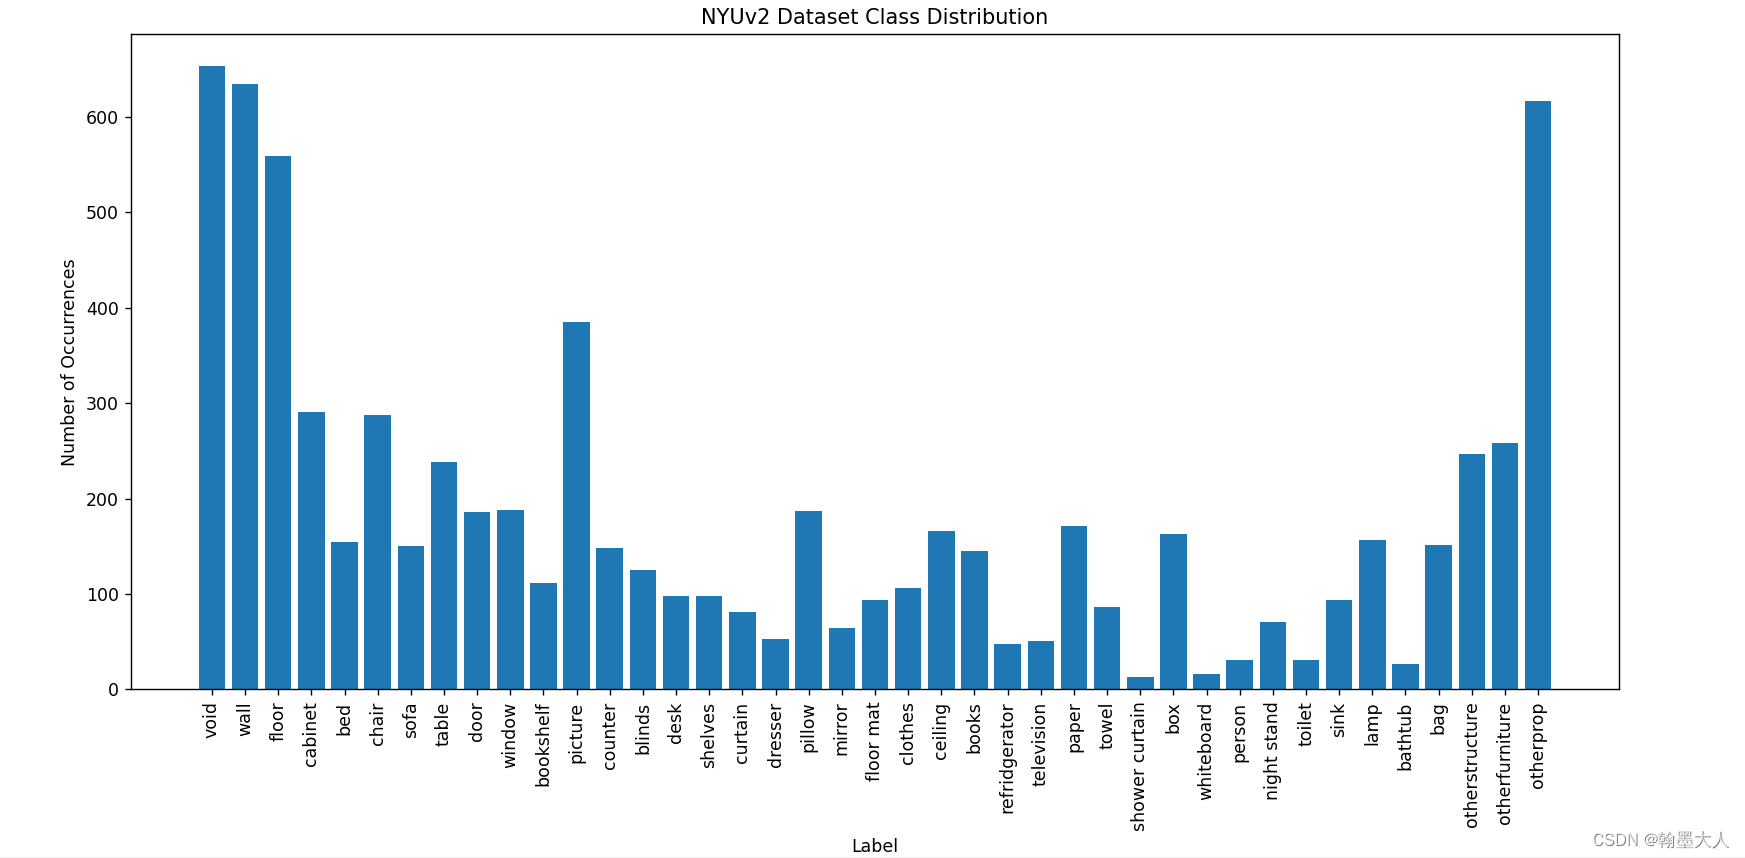
4:测试集有654张图片。

6:将训练集的Counter中的数据用条形图显示出来:
7:将验证集的Counter中的数据用条形图显示出来:
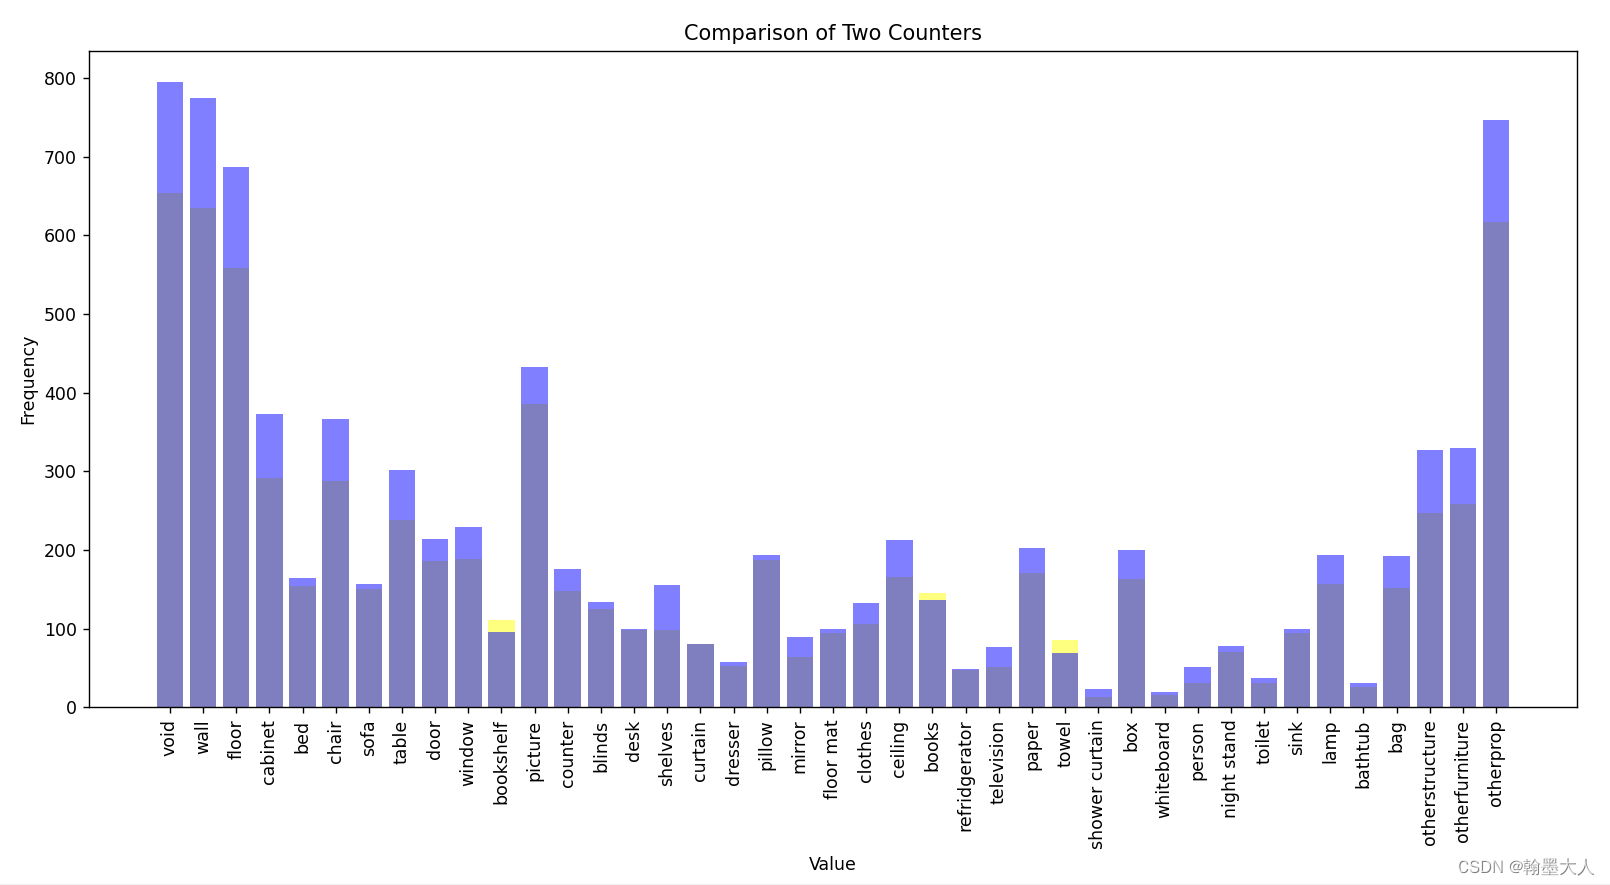
8:将验证集和训练集放在一起:
test_data1 = Counter({0: 654, 1: 635, 40: 617, 2: 559, 11: 385, 3: 291, 5: 288, 39: 258, 38: 247, 7: 238, 9: 188, 18: 187, 8: 186, 26: 171, 22: 166, 29: 163, 35: 157, 4: 154, 37: 151, 6: 150, 12: 148, 23: 145, 13: 125, 10: 111, 21: 106, 15: 98, 14: 98, 34: 94, 20: 94, 27: 86, 16: 81, 32: 70, 19: 64, 17: 53, 25: 51, 24: 47, 33: 31, 31: 31, 36: 26, 30: 16, 28: 13})
train_data2 = Counter({0: 795, 1: 774, 40: 747, 2: 687, 11: 433, 3: 373, 5: 366, 39: 329, 38: 327, 7: 301, 9: 229, 8: 214, 22: 212, 26: 202, 29: 200, 35: 194, 18: 193, 37: 192, 12: 176, 4: 164, 6: 157, 15: 155, 23: 136, 13: 134, 21: 132, 14: 99, 34: 99, 20: 99, 10: 96, 19: 89, 16: 80, 32: 78, 25: 77, 27: 69, 17: 58, 31: 51, 24: 48, 33: 37, 36: 31, 28: 23, 30: 19})

# 将数据转换为x和y坐标列表
x1, y1 = zip(*test_data1.items())
x2, y2 = zip(*train_data2.items())

# 创建条状图
plt.bar(x1, y1, color='yellow', alpha=0.5)
plt.bar(x2, y2, color='blue', alpha=0.5)


 3050
3050


 被折叠的 条评论
为什么被折叠?
被折叠的 条评论
为什么被折叠?
 到【灌水乐园】发言


