


有的时候将DataFrame中的多列数据变层两列和三列数据进行画图,这种操作称为melt, 在R和python中都有实现,记录如下
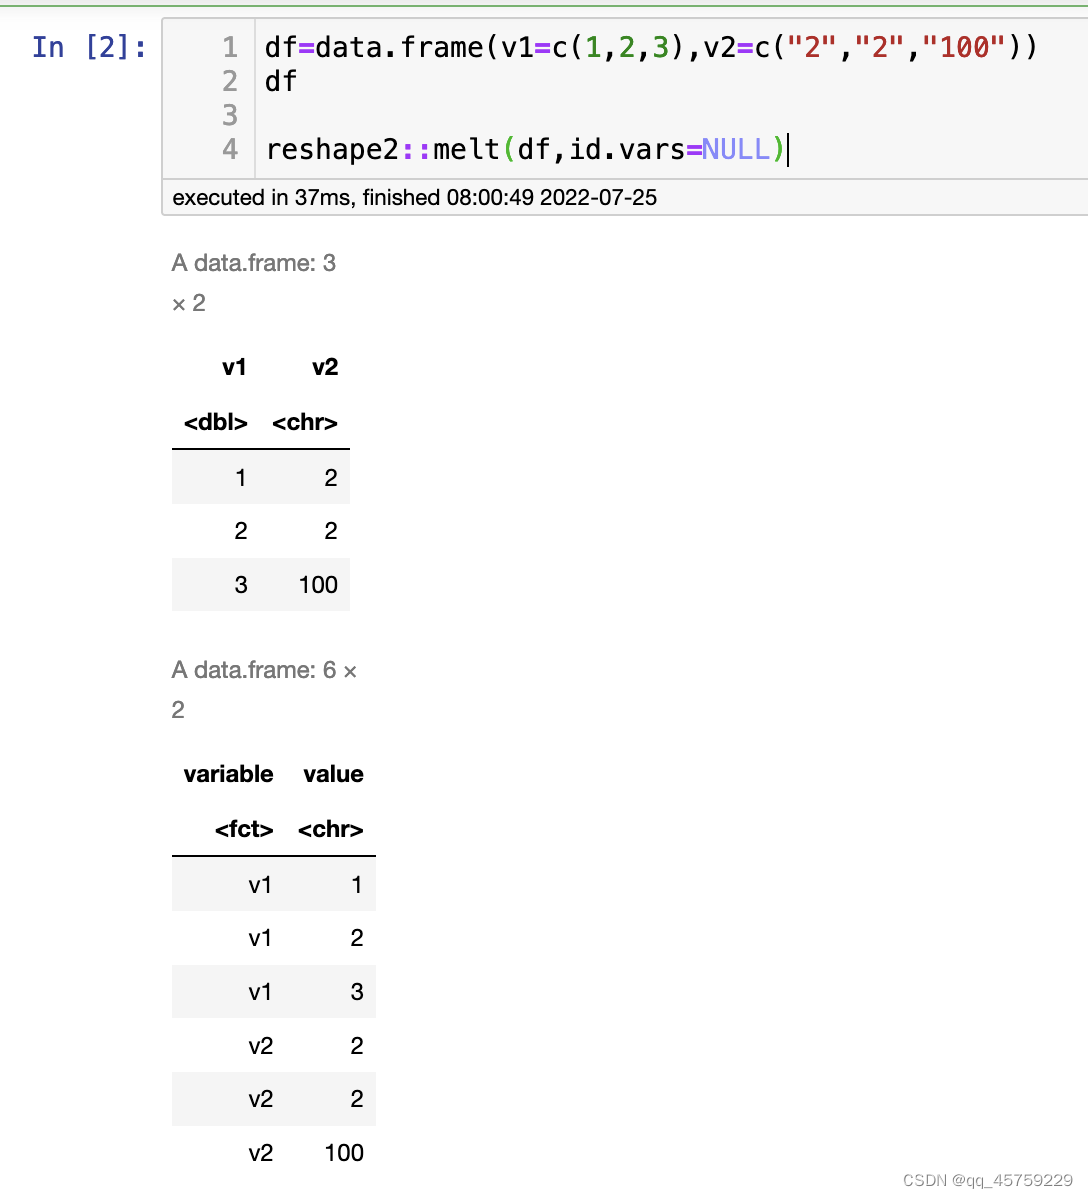
R将两列合并成一列
df=data.frame(v1=c(1,2,3),v2=c("2","2","100"))
df
reshape2::melt(df,id.vars=NULL)
结果如下
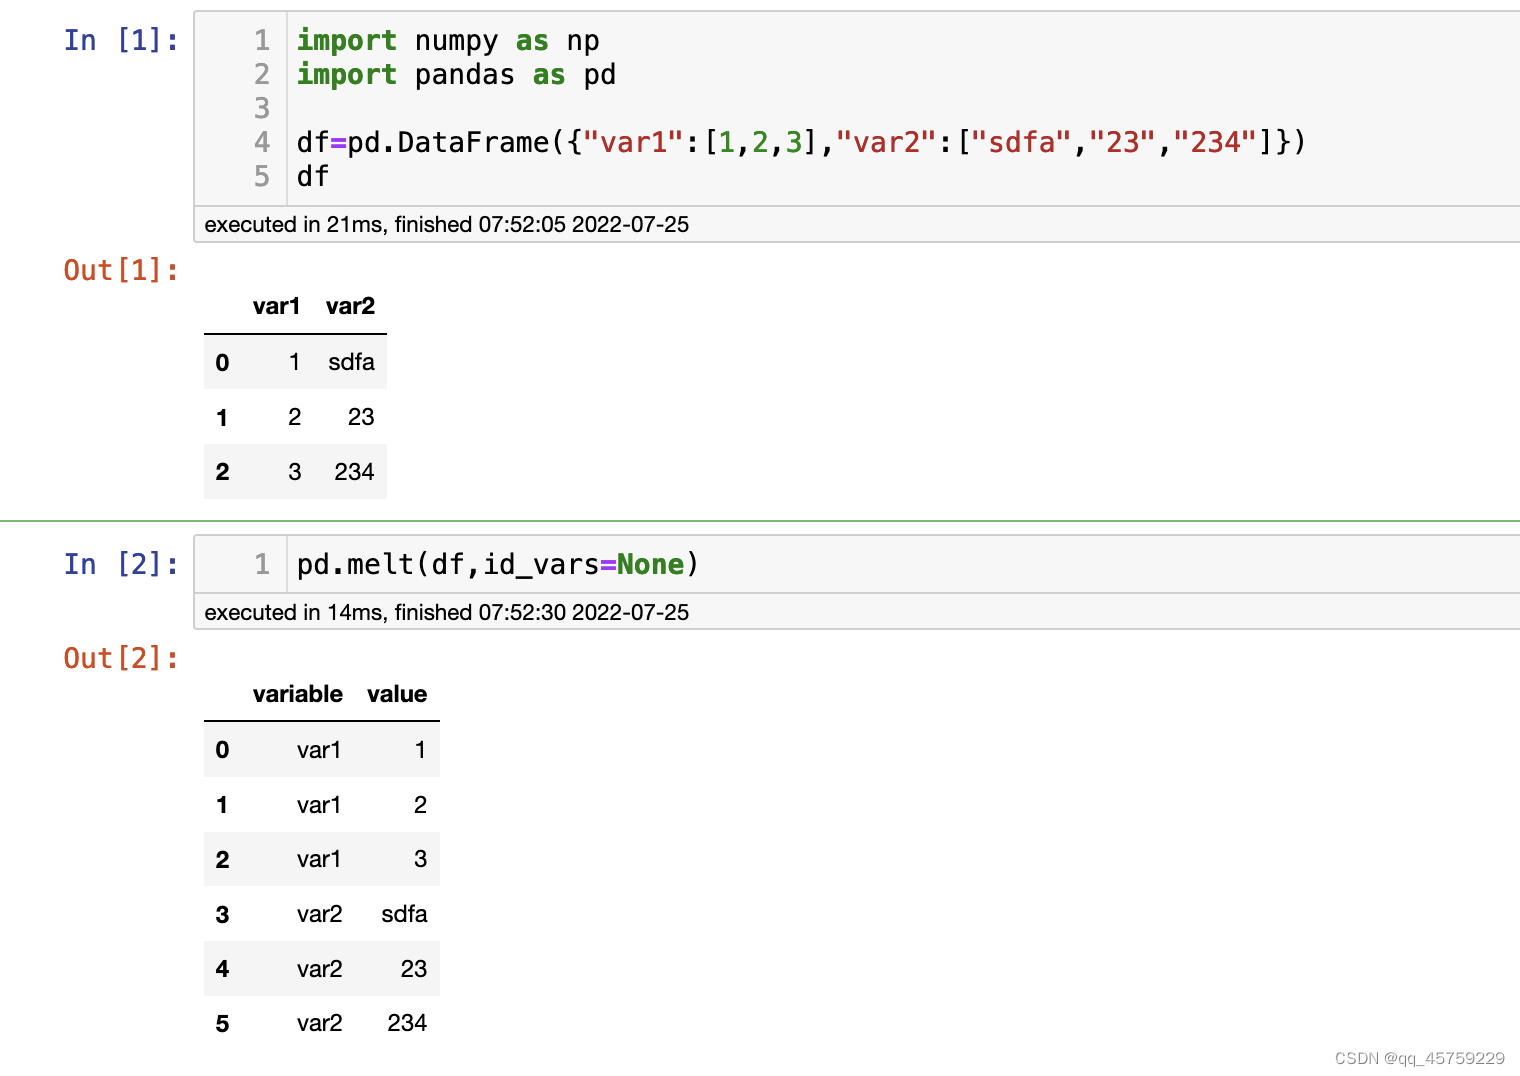
python将两列合并成一列
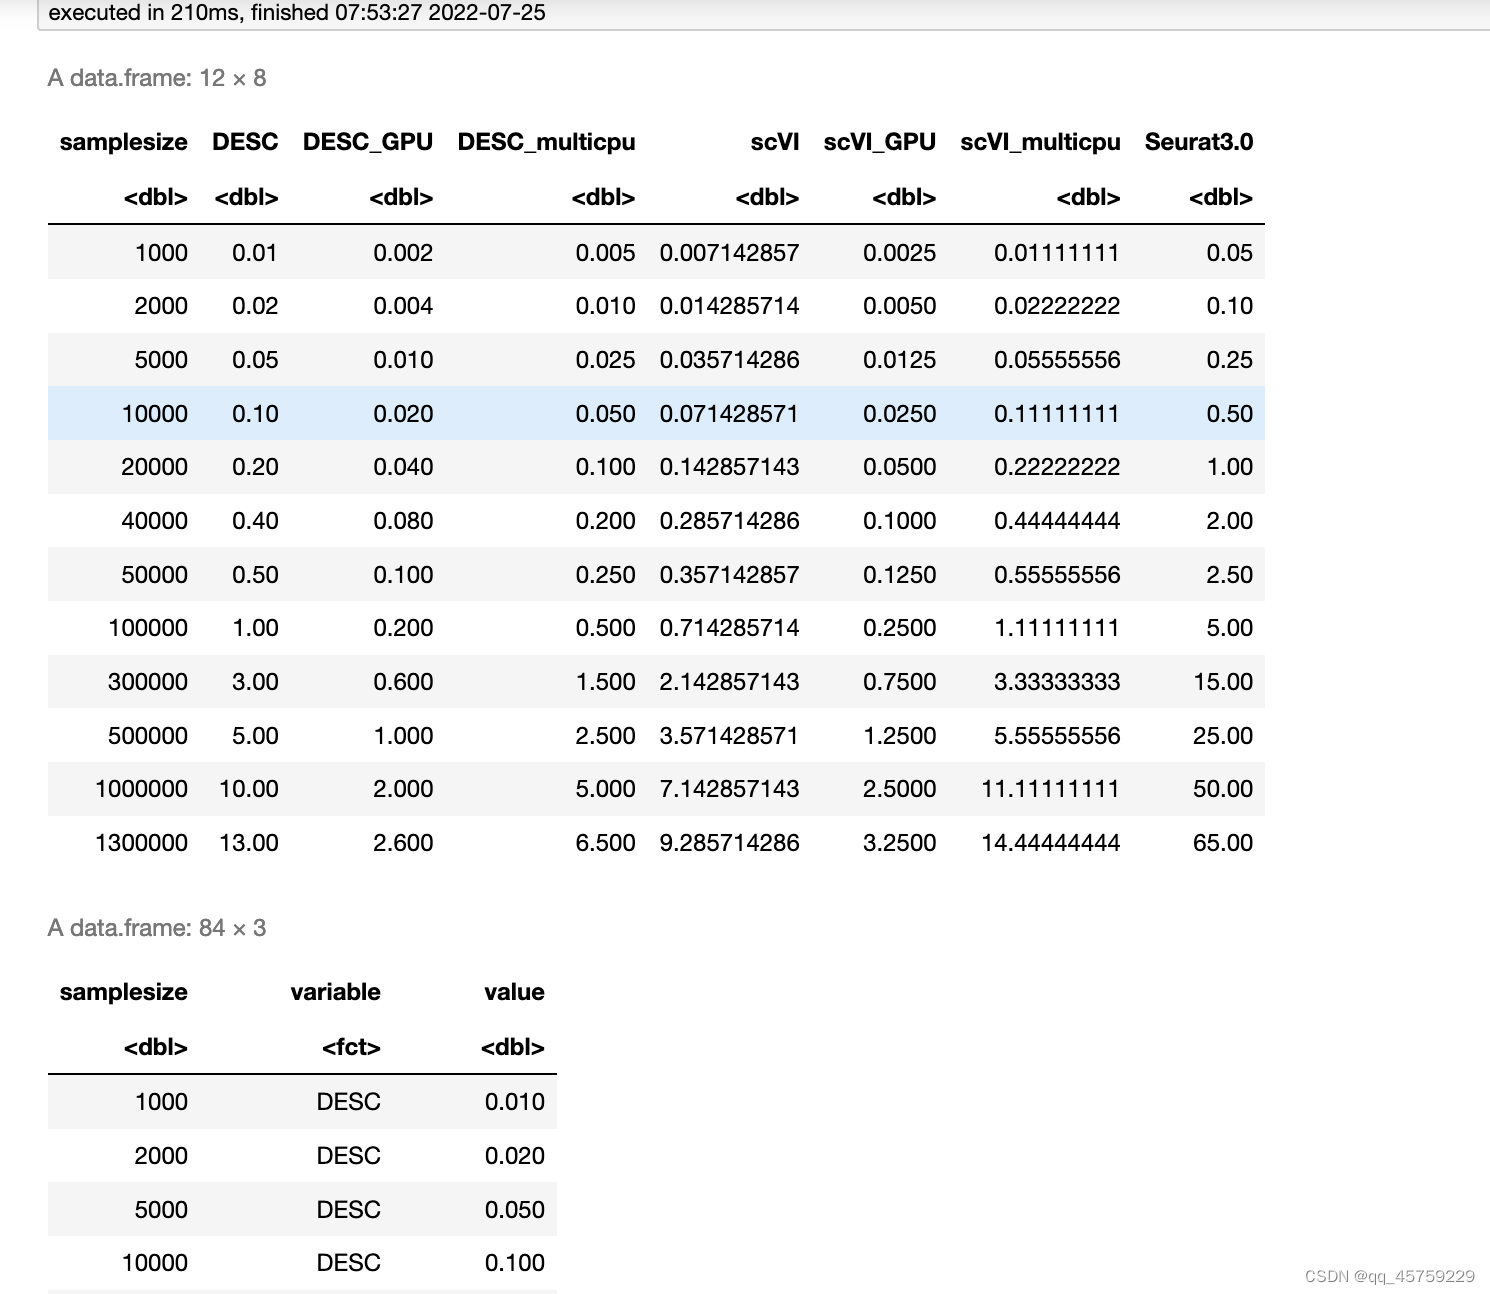
R将多列数据合并成三列
samplesize=c(1000,2000,5000,10000,20000,40000,50000,100000,300000,500000,1000000,1300000)
methods=c("DESC","DESC_GPU","DESC_multicpu","scVI","scVI_GPU","scVI_multicpu","Seurat3.0")

f_mem=function(x){
  t1= x/100000
  t2 =x/110000
  t3= x/200000
  t4= x/140000
  t2 =x/500000
  t5 =x/400000
  t6= x/90000
  t7= x/20000

  mem =data.frame(samplesize=samplesize,t1=t1,t2=t2,t3=t3,t4=t4,t5=t5,t6=t6,t7=t7)
  colnames(mem)=c("samplesize",methods)
  return(mem)
}


mem_df =f_mem(samplesize)
write.csv(mem_df,file="./mem_df.csv")

mem_df
mem_final=reshape2::melt(mem_df,id.var="samplesize")
mem_final
结果如下
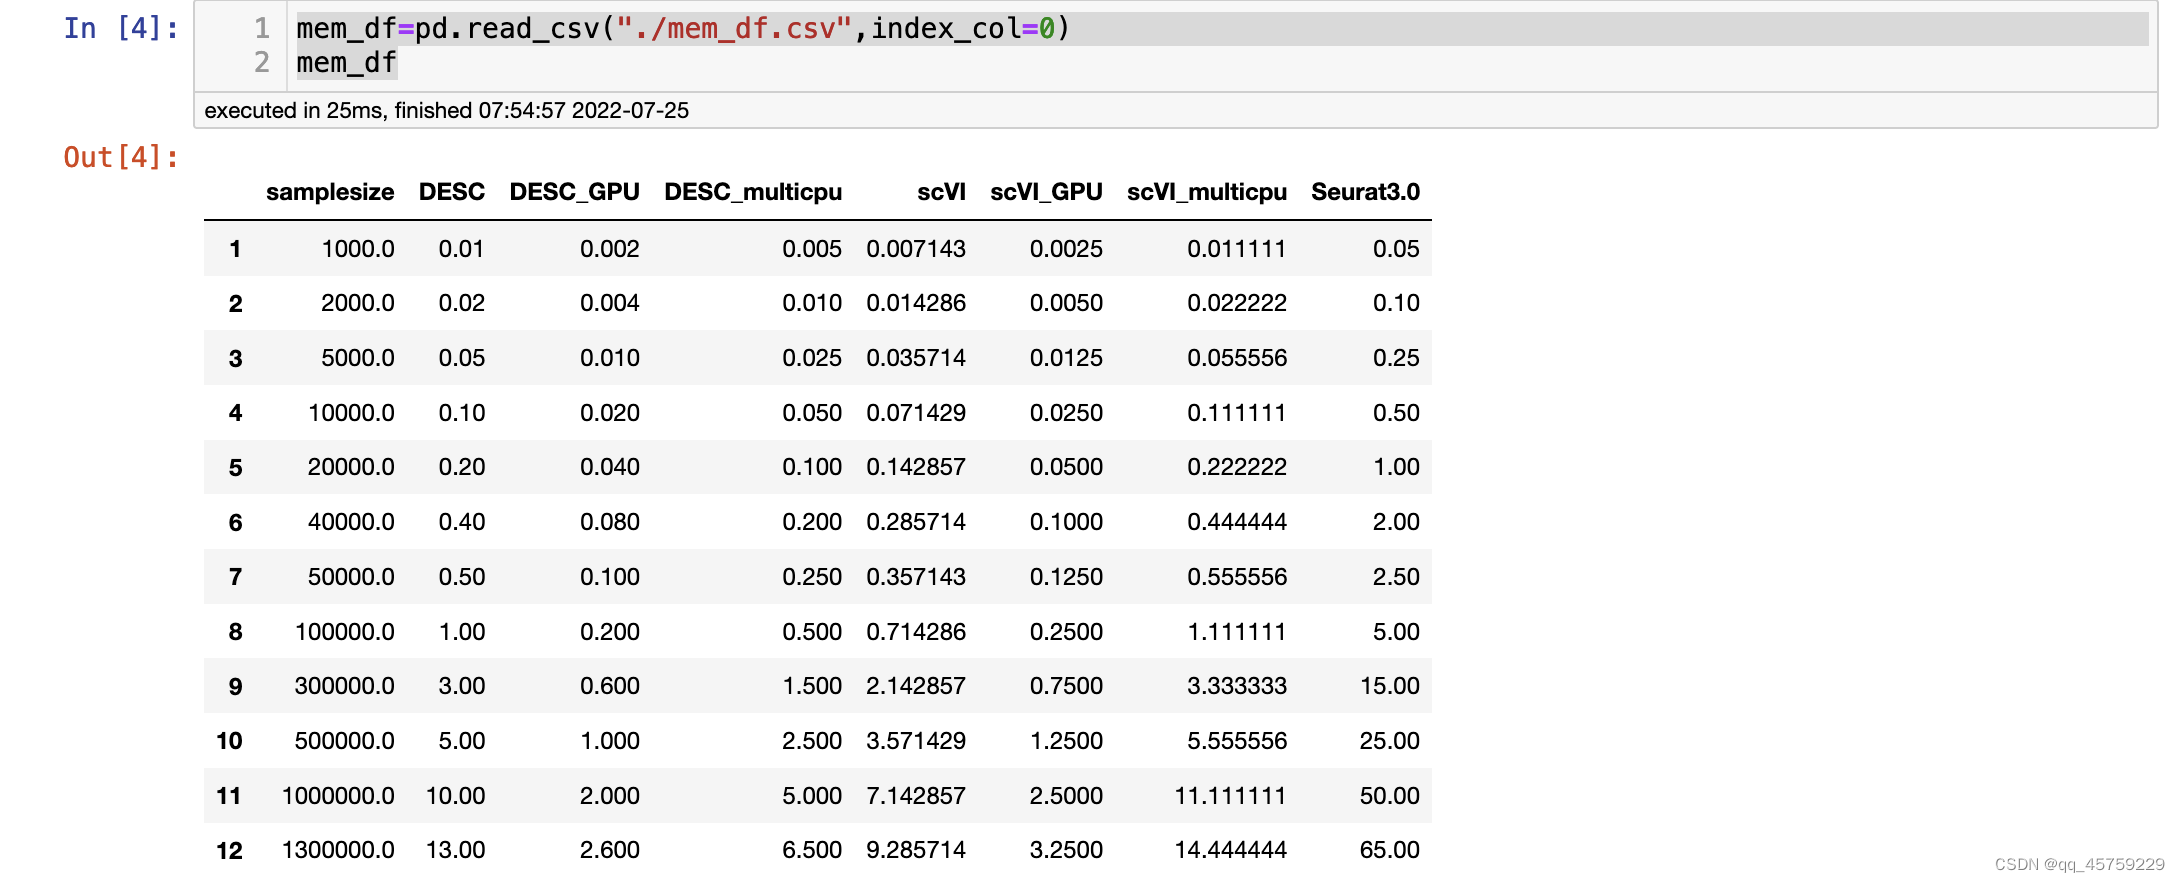
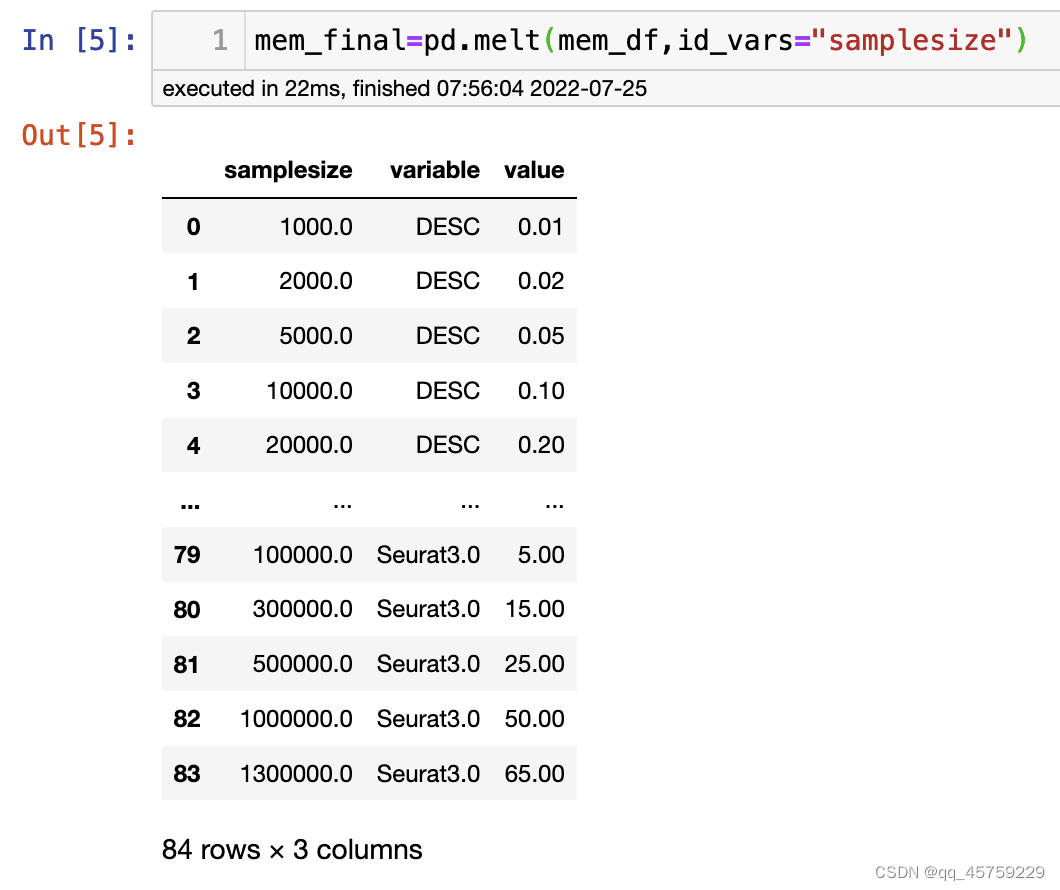
python将多列数据合并成三列
mem_df=pd.read_csv("./mem_df.csv",index_col=0)
mem_df

mem_final=pd.melt(mem_df,id_vars="samplesize")
结果如下


 773
773


 被折叠的 条评论
为什么被折叠?
被折叠的 条评论
为什么被折叠?
 到【灌水乐园】发言


