


如果特征和目标之间存在非线性关系,建模变得很困难,特别
是回归问题
log和exp函数可以帮助调节数据的相对比例,改进线性模型或者神经网络的学习效果
在处理周期性模式的数据时,sin和cos函数非常有用
大部分模型在每个特征遵循高斯分布时表现很好
(1)模拟数据(钟形分布的数据)
rnd = np.random.RandomState(0)
X_org = rnd.normal(size=(1000, 3))
w = rnd.normal(size=3)

X = rnd.poisson(10 * np.exp(X_org))
y = np.dot(X_org, w)
难以找出特定的模式
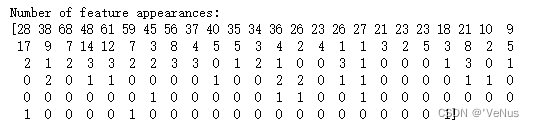
(2)计算每个值出现的次数
print("Number of feature appearances:\n{}".format(np.bincount(X[:, 0])))
(3)计数可视化
bins = np.bincount(X[:, 0])
plt.bar(range(len(bins)), bins, color='grey')
plt.ylabel("Number of appearances")
plt.xlabel("Value")
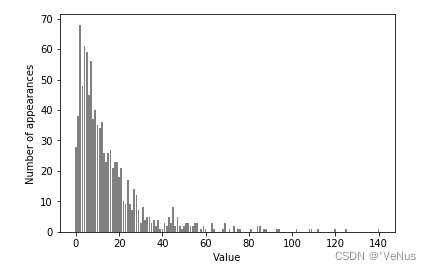
特征X[:,1],X[:,2]具有类似的性质,为泊松分布
(4)拟合岭回归模型
from sklearn.linear_model import Ridge
X_train, X_test, y_train, y_test = train_test_split(X, y, random_state=0)
score = Ridge().fit(X_train, y_train).score(X_test, y_test)
print("Test score: {:.3f}".format(score))
无法直接捕捉到X和y之间的关系,应用对数变换
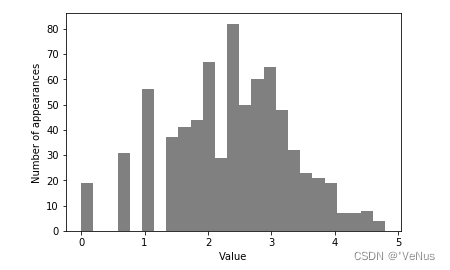
(5)计算log(X+1)
X_train_log = np.log(X_train + 1)
X_test_log = np.log(X_test + 1)
变换后数据分布的不对称性变小,不再有非常大的异常值,如图:
plt.hist(X_train_log[:, 0], bins=25, color='gray')
plt.ylabel("Number of appearances")
plt.xlabel("Value")
(7)构建岭回归模型
score = Ridge().fit(X_train_log, y_train).score(X_test_log, y_test)
print("Test score: {:.3f}".format(score))
在新数据上构建得到了更好得拟合
有时一部分特征应该变换,有时每个特征的变化方式各不相同,只对部分数据进行变换,对基于树的模型而言,这种变换不重要,但对线性模型来说至关重要的。
对于复杂度较低的线性模型,分箱、多项式和交互式有很大的提升。
基于树的模型通常能够自己发现重要的交互项,大多数情况下不需要显式地变换数据。


 810
810


 被折叠的 条评论
为什么被折叠?
被折叠的 条评论
为什么被折叠?
 到【灌水乐园】发言


