


|
1 2 3 4 5 6 7 8 9 10 11 12 13 14 15 16 17 18 19 20 21 22 23 24 25 26 27 28 29 30 31 |
|
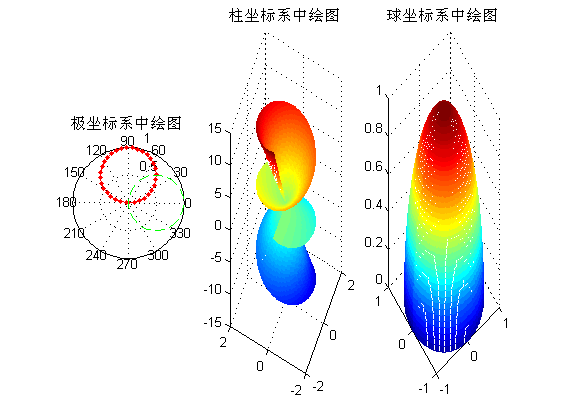
 本文介绍如何使用MATLAB在极坐标系、柱坐标系及球坐标系中绘制特定图形。通过定义不同坐标的参数,利用polar、mesh等函数实现图形绘制,并展示了不同坐标系间的转换方法。
|
1 2 3 4 5 6 7 8 9 10 11 12 13 14 15 16 17 18 19 20 21 22 23 24 25 26 27 28 29 30 31 |
|
 2795
9930
3万+
2795
9930
3万+

 被折叠的 条评论
为什么被折叠?
被折叠的 条评论
为什么被折叠?
 到【灌水乐园】发言


