


 本文介绍了一种使用Python脚本,通过pyshark库解析pcapng文件,提取allbus-tap报文的时间戳,并将其导出到CSV文件中,以便后续数据分析和实时性检查。
之前的文章中描述了如何通过wireshark手工导出allbus-tap的报文时间戳,对于批量的文件不太方便,下文介绍一种使用脚本解析pcapng的方法,可以快速把报文中的时间戳信息导出到csv文件中。
代码如下:
import pyshark
import pandas as pd
from datetime import datetime
pcapng_file = "3.pcapng"
capture=pyshark.FileCapture(pcapng_file)
PKT_MAX_NUM = 20000
timestamp_old = 0
warning_list = []
data_list = []
idx = 0
timestamp_first = 0
for pkt in capture:
if idx > PKT_MAX_NUM:
break
layer = pkt.get_multiple_layers("TAP")
if layer == []:
warning_list.append(["index:%d Layer Error Detected"%idx])
continue
length = pkt.length
dst_mac = pkt.ETH.dst
src_mac = pkt.ETH.src
type = pkt.ETH.type
timestamp_ns = int(pkt.TAP.timestamp,16)
fcs = pkt.TAP.fcs
channel = pkt.TAP.channel
port = "X1.2" if pkt.TAP.port == "0x00000040" else "X1.1"
recv_err = pkt.TAP.rxerror
align_err = pkt.TAP.alignerror
crc_err = pkt.TAP.crcerror
if idx == 0:
timestamp_first = timestamp_ns
timestamp_ns = timestamp_ns - timestamp_first
if(idx % 100 == 0):
print("processing....",idx)
data_list.append([idx,
length,
src_mac,
dst_mac,
type,
timestamp_ns ,
fcs ,
channel ,
port ,
recv_err ,
align_err ,
crc_err ] )
idx += 1
time_str = str(datetime.now().strftime("%Y_%m_%d_%H_%M_%S"))
output_file = time_str + "_allbus_parser.csv"
for x in warning_list:
print(x)
df = pd.DataFrame(data_list,columns=[
"Index",
"Length",
"Source MAC",
"Dest MAc" ,
"Eth Type" ,
"Timestamp(ns)" ,
"FCS" ,
"Channel" ,
"Port" ,
"Receive Error" ,
"Alignment Error",
"Crc Error" ])
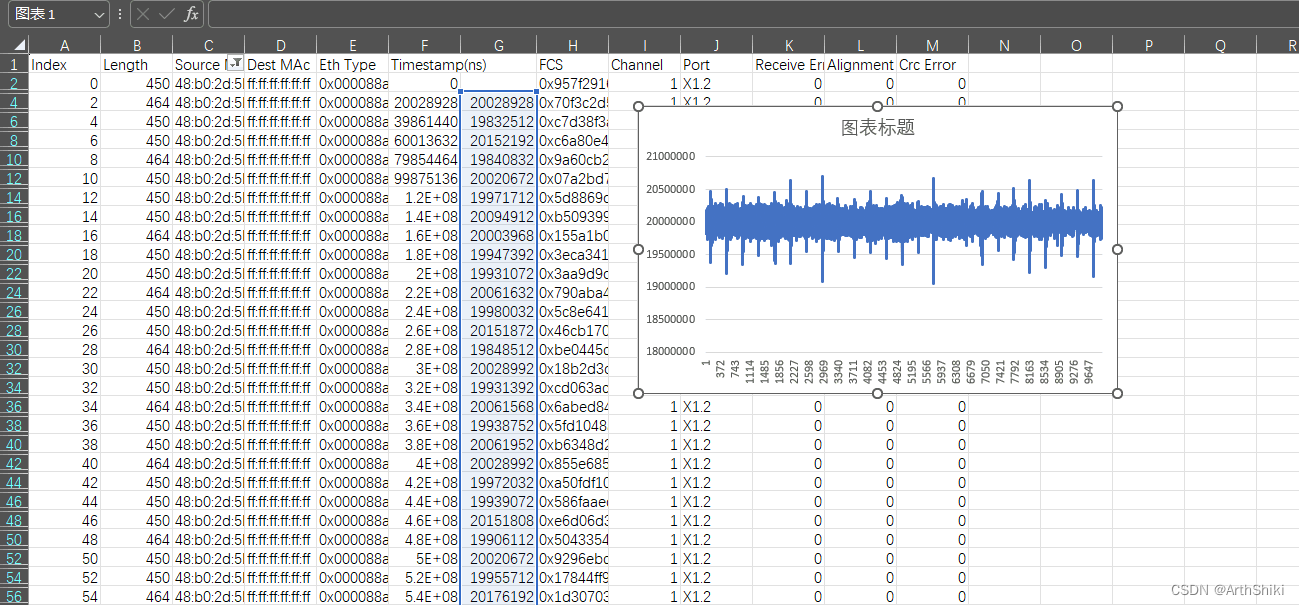
df.to_csv(output_file,index=False)导出的csv文件即可通过excel进行画图分析实时性,当然有兴趣也可以通过python直接绘图


 3043
3043

 被折叠的 条评论
为什么被折叠?
被折叠的 条评论
为什么被折叠?
 到【灌水乐园】发言


