


在我的研究工作中,我广泛使用 MATLAB 进行分析和可视化。很多时候,我创建的图形用于我的出版物。就在那时,我开始探索 Handle Graphics 的灵活性,以自定义 MATLAB绘图以创建出版质量的图形。最终,我几乎可以完全将 MATLAB 用于我的绘图。
让我逐步向您介绍我是如何做到的。我使用的是一些捏造的数据,但绘图与我为研究生成的数据非常相似。
导入数据
首先,您可能会下载数据。
load data
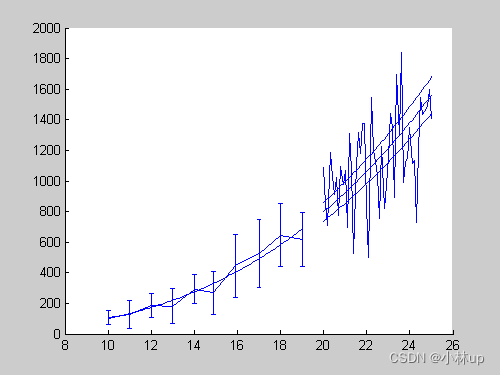
基本绘图
figure('Units', 'pixels', ...
    'Position', [100 100 500 375]);
hold on;

hFit   = line(xfit  , yfit   );
hE     = errorbar(xdata_m, ydata_m, ydata_s);
hData  = line(xVdata, yVdata );
hModel = line(xmodel, ymodel );
hCI(1) = line(xmodel, ymodelL);
hCI(2) = line(xmodel, ymodelU);
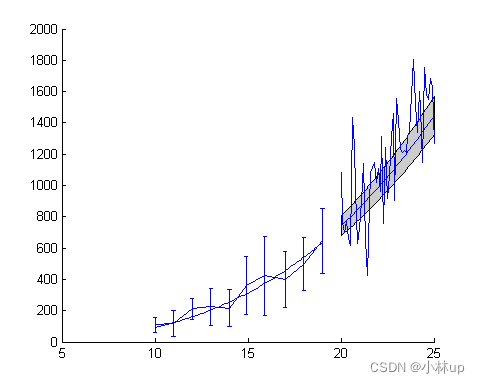
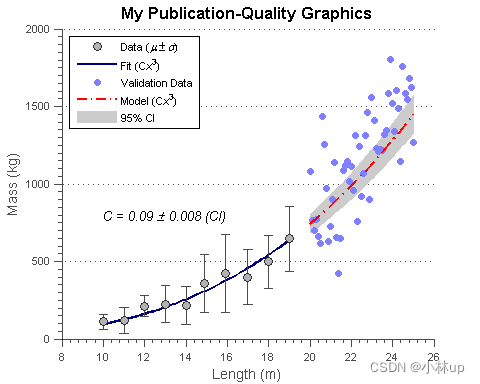
如果hCI的两行代码改成
hCI    = patch([xmodel,fliplr(xmodel)], [ymodelL,fliplr(ymodelU)], ...
               [.8 .8 .8]);
则有类似下面的形式
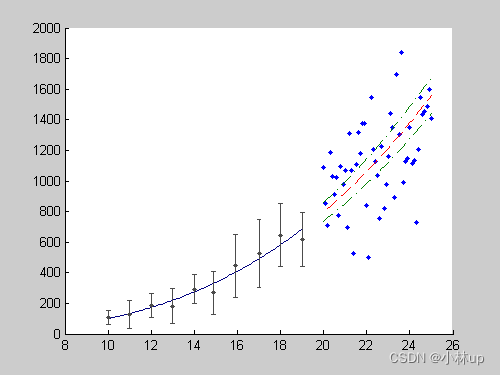
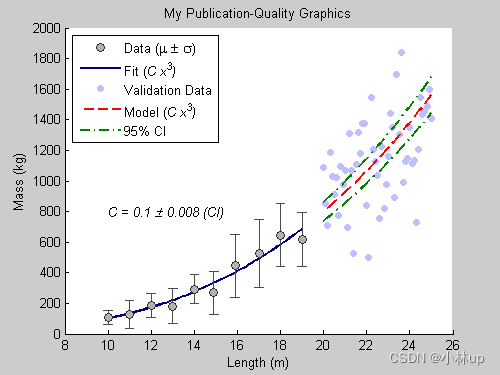
进行第一轮修改,不需要担心是否完美。
set(hFit                          , ...
  'Color'           , [0 0 .5]    );
set(hE                            , ...
  'LineStyle'       , 'none'      , ...
  'Marker'          , '.'         , ...
  'Color'           , [.3 .3 .3]  );
set(hData                         , ...
  'LineStyle'       , 'none'      , ...
  'Marker'          , '.'         );
set(hModel                        , ...
  'LineStyle'       , '--'        , ...
  'Color'           , 'r'         );
set(hCI(1)                        , ...
  'LineStyle'       , '-.'        , ...
  'Color'           , [0 .5 0]    );
set(hCI(2)                        , ...
  'LineStyle'       , '-.'        , ...
  'Color'           , [0 .5 0]    );
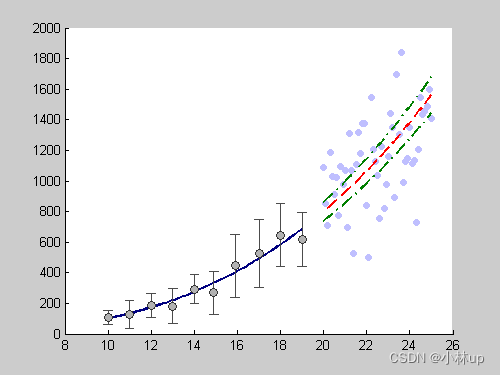
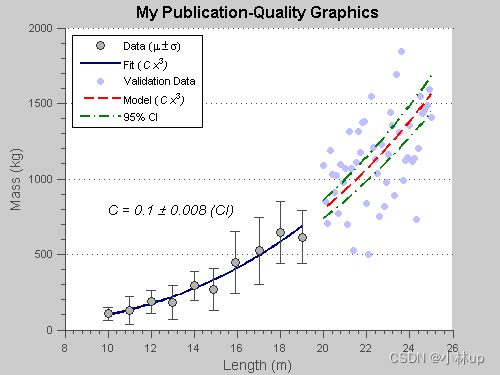
调整线型
为了使其更具出版质量,我对线条属性进行了以下更改,包括错误栏宽度。在我看来,使用更粗的线条和更大的标记可以极大地改善图形的“外观”。这是相当主观的,但我根据图表上的数据量来选择它们。我选择适当的“拥挤度”(黑白空间的平衡):
set(hFit                          , ...
  'LineWidth'       , 2           );
set(hE                            , ...
  'LineWidth'       , 1           , ...
  'Marker'          , 'o'         , ...
  'MarkerSize'      , 6           , ...
  'MarkerEdgeColor' , [.2 .2 .2]  , ...
  'MarkerFaceColor' , [.7 .7 .7]  );
set(hData                         , ...
  'Marker'          , 'o'         , ...
  'MarkerSize'      , 5           , ...
  'MarkerEdgeColor' , 'none'      , ...
  'MarkerFaceColor' , [.75 .75 1] );
set(hModel                        , ...
  'LineWidth'       , 1.5         );
set(hCI(1)                        , ...
  'LineWidth'       , 1.5         );
set(hCI(2)                        , ...
  'LineWidth'       , 1.5         );

% adjust error bar width
hE_c                   = ...
    get(hE     , 'Children'    );
errorbarXData          = ...
    get(hE_c(2), 'XData'       );
errorbarXData(4:9:end) = ...
    errorbarXData(1:9:end) - 0.2;
errorbarXData(7:9:end) = ....
    errorbarXData(1:9:end) - 0.2;
errorbarXData(5:9:end) = ...
    errorbarXData(1:9:end) + 0.2;
errorbarXData(8:9:end) = ...
    errorbarXData(1:9:end) + 0.2;
set(hE_c(2), 'XData', errorbarXData);
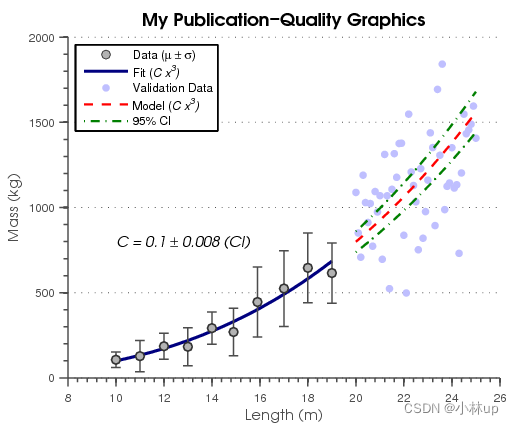
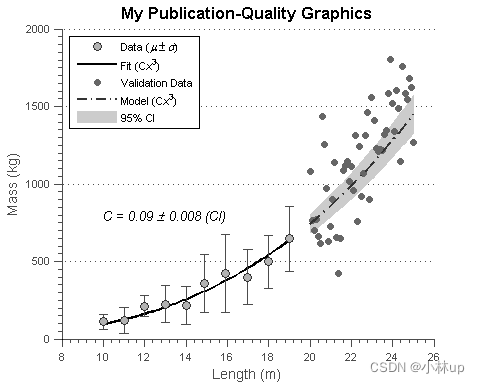
添加label和legend
hTitle  = title ('My Publication-Quality Graphics');
hXLabel = xlabel('Length (m)'                     );
hYLabel = ylabel('Mass (kg)'                      );

hText   = text(10, 800, ...
  sprintf('\\it{C = %0.1g \\pm %0.1g (CI)}', ...
  c, cint(2)-c));

hLegend = legend( ...
  [hE, hFit, hData, hModel, hCI(1)], ...
  'Data (\mu \pm \sigma)' , ...
  'Fit (\it{C x^3})'      , ...
  'Validation Data'       , ...
  'Model (\it{C x^3})'    , ...
  '95% CI'                , ...
  'location', 'NorthWest' );
调整字体和坐标轴
由于许多出版物都接受 EPS 格式,还定义了刻度位置,尤其是当默认设置太拥挤时。
set( gca                       , ...
    'FontName'   , 'Helvetica' );
set([hTitle, hXLabel, hYLabel, hText], ...
    'FontName'   , 'AvantGarde');
set([hLegend, gca]             , ...
    'FontSize'   , 8           );
set([hXLabel, hYLabel, hText]  , ...
    'FontSize'   , 10          );
set( hTitle                    , ...
    'FontSize'   , 12          , ...
    'FontWeight' , 'bold'      );

set(gca, ...
  'Box'         , 'off'     , ...
  'TickDir'     , 'out'     , ...
  'TickLength'  , [.02 .02] , ...
  'XMinorTick'  , 'on'      , ...
  'YMinorTick'  , 'on'      , ...
  'YGrid'       , 'on'      , ...
  'XColor'      , [.3 .3 .3], ...
  'YColor'      , [.3 .3 .3], ...
  'YTick'       , 0:500:2500, ...
  'LineWidth'   , 1         );
导出eps文件
我将PaperPositionMode设置为 auto,以便导出的图形看起来像在屏幕上一样。
set(gcf, 'PaperPositionMode', 'auto');
print -depsc2 finalPlot1.eps
close;
如果要指定最终尺寸,设置PaperSize和PaperPosition属性。如果要导出为 postscript 格式时,选择“-loose”选项以确保不裁剪图形边缘。
改进的matlab语句为:
set(gcf, 'PaperPositionMode', 'auto');
set(gcf, 'PaperUnits', 'inches', 'PaperSize', [5 4]);

print -depsc2 -loose finalPlot.eps
也可以设置导出黑白颜色的eps文件:
set(hFit  , 'Color'           , 'k'       );
set(hModel, 'Color'           , [.2 .2 .2]);
set(hData , 'MarkerFaceColor' , [.4 .4 .4]);

print -depsc2 -loose finalPlotBW.eps
上面都使用了matlab的图形句柄,有关图形句柄可以看我的另一篇文章matlab画图句柄,在画图过程中我们经常需要调整图形的格式,所以理解使用句柄有利我们更好地画图。
参考
[1]Making Pretty Graphs
[2]Customizing Graphics Programmatically


 7492
7492


 被折叠的 条评论
为什么被折叠?
被折叠的 条评论
为什么被折叠?
 到【灌水乐园】发言


