


引言
本文[1]将带您分析一个单细胞联合检测数据集,该数据集能够同时测量细胞内的基因表达水平和DNA的可及性。
这项数据集由Chen、Lake和Zhang在2019年发表,采用了一种名为SNARE-seq的技术。由于该数据集并未公开,我们已将原始数据重新映射至mm10基因组。您可以通过以下链接下载:
-
片段文件:https://signac-objects.s3.amazonaws.com/snareseq/fragments.sort.bed.gz -
片段文件的索引文件:https://signac-objects.s3.amazonaws.com/snareseq/fragments.sort.bed.gz.tbi -
用于从原始数据生成片段文件的代码:https://github.com/timoast/SNARE-seq
数据加载
首先构建了一个Seurat对象,它包含了两种不同的检测类型:一种是基因表达数据,另一种是DNA的可及性数据。
在加载计数数据时,我们利用Seurat提供的Read10X()功能。使用这个功能之前,需要将barcodes.tsv.gz、matrix.mtx.gz和features.tsv.gz这些文件整理到一个单独的文件夹中。
library(Signac)
library(Seurat)
library(ggplot2)
library(EnsDb.Mmusculus.v79)

# load processed data matrices for each assay
rna <- Read10X("../vignette_data/snare-seq/GSE126074_AdBrainCortex_rna/", gene.column = 1)
atac <- Read10X("../vignette_data/snare-seq/GSE126074_AdBrainCortex_atac/", gene.column = 1)
fragments <- "../vignette_data/snare-seq/fragments.sort.bed.gz"

# create a Seurat object and add the assays
snare <- CreateSeuratObject(counts = rna)
snare[['ATAC']] <- CreateChromatinAssay(
  counts = atac,
  sep = c(":", "-"),
  genome = "mm10",
  fragments = fragments
)

# extract gene annotations from EnsDb
annotations <- GetGRangesFromEnsDb(ensdb = EnsDb.Mmusculus.v79)

# change to UCSC style since the data was mapped to mm10
seqlevels(annotations) <- paste0('chr', seqlevels(annotations))
genome(annotations) <- "mm10"

# add the gene information to the object
Annotation(snare[["ATAC"]]) <- annotations
数据质控
DefaultAssay(snare) <- "ATAC"
snare <- TSSEnrichment(snare)
snare <- NucleosomeSignal(snare)
snare$blacklist_fraction <- FractionCountsInRegion(
  object = snare,
  assay = 'ATAC',
  regions = blacklist_mm10
)

Idents(snare) <- "all"  # group all cells together, rather than by replicate
VlnPlot(
  snare,
  features = c("nCount_RNA", "nCount_ATAC", "TSS.enrichment",
               "nucleosome_signal", "blacklist_fraction"),
  pt.size = 0.1,
  ncol = 5
)
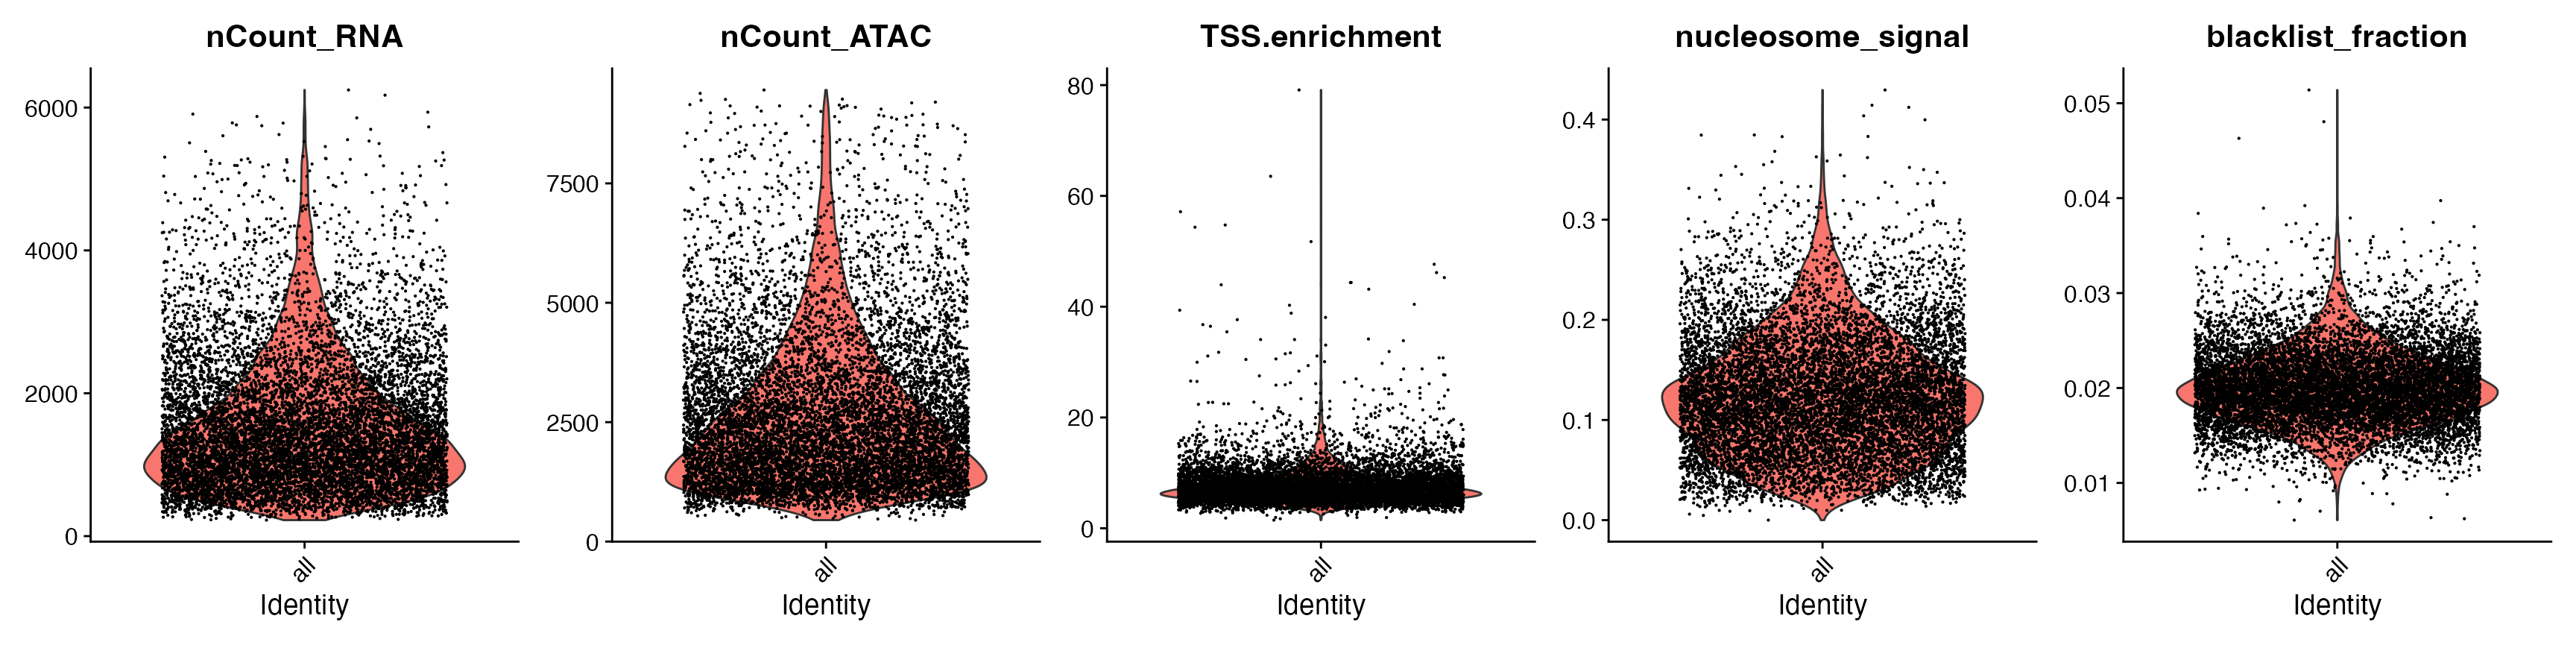
snare <- subset(
  x = snare,
  subset = blacklist_fraction < 0.03 &
    TSS.enrichment < 20 &
    nCount_RNA > 800 &
    nCount_ATAC > 500
)
snare
## An object of class Seurat
## 277704 features across 8055 samples within 2 assays
## Active assay: ATAC (244544 features, 0 variable features)
##  2 layers present: counts, data
##  1 other assay present: RNA
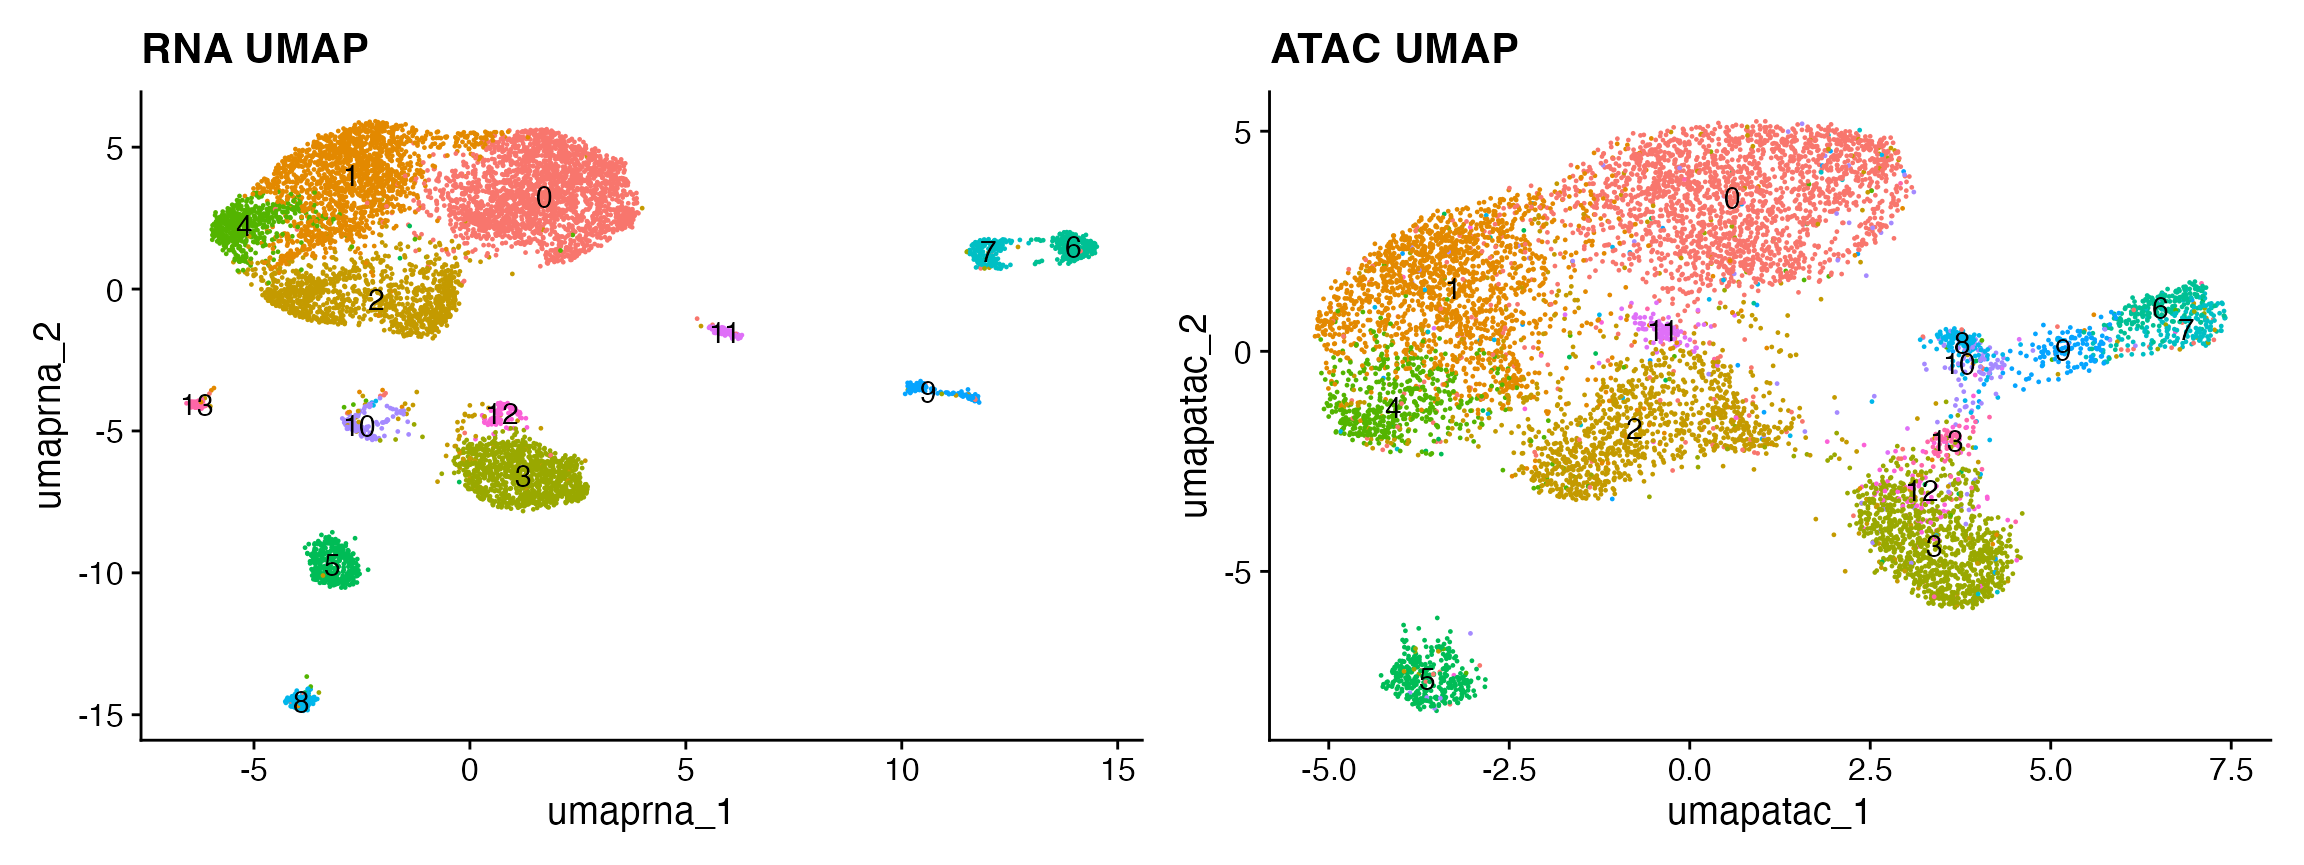
基因表达数据处理
-
使用 Seurat 处理基因表达数据
DefaultAssay(snare) <- "RNA"

snare <- FindVariableFeatures(snare, nfeatures = 3000)
snare <- NormalizeData(snare)
snare <- ScaleData(snare)
snare <- RunPCA(snare, npcs = 30)
snare <- RunUMAP(snare, dims = 1:30, reduction.name = "umap.rna")
snare <- FindNeighbors(snare, dims = 1:30)
snare <- FindClusters(snare, resolution = 0.5, algorithm = 3)
## Modularity Optimizer version 1.3.0 by Ludo Waltman and Nees Jan van Eck
##
## Number of nodes: 8055
## Number of edges: 324240
##
## Running smart local moving algorithm...
## Maximum modularity in 10 random starts: 0.8900
## Number of communities: 14
## Elapsed time: 4 seconds

p1 <- DimPlot(snare, label = TRUE) + NoLegend() + ggtitle("RNA UMAP")
DNA可及性数据处理
-
使用 Signac 处理 DNA 可及性数据
DefaultAssay(snare) <- 'ATAC'

snare <- FindTopFeatures(snare, min.cutoff = 10)
snare <- RunTFIDF(snare)
snare <- RunSVD(snare)
snare <- RunUMAP(snare, reduction = 'lsi', dims = 2:30, reduction.name = 'umap.atac')
p2 <- DimPlot(snare, reduction = 'umap.atac', label = TRUE) + NoLegend() + ggtitle("ATAC UMAP")

p1 + p2
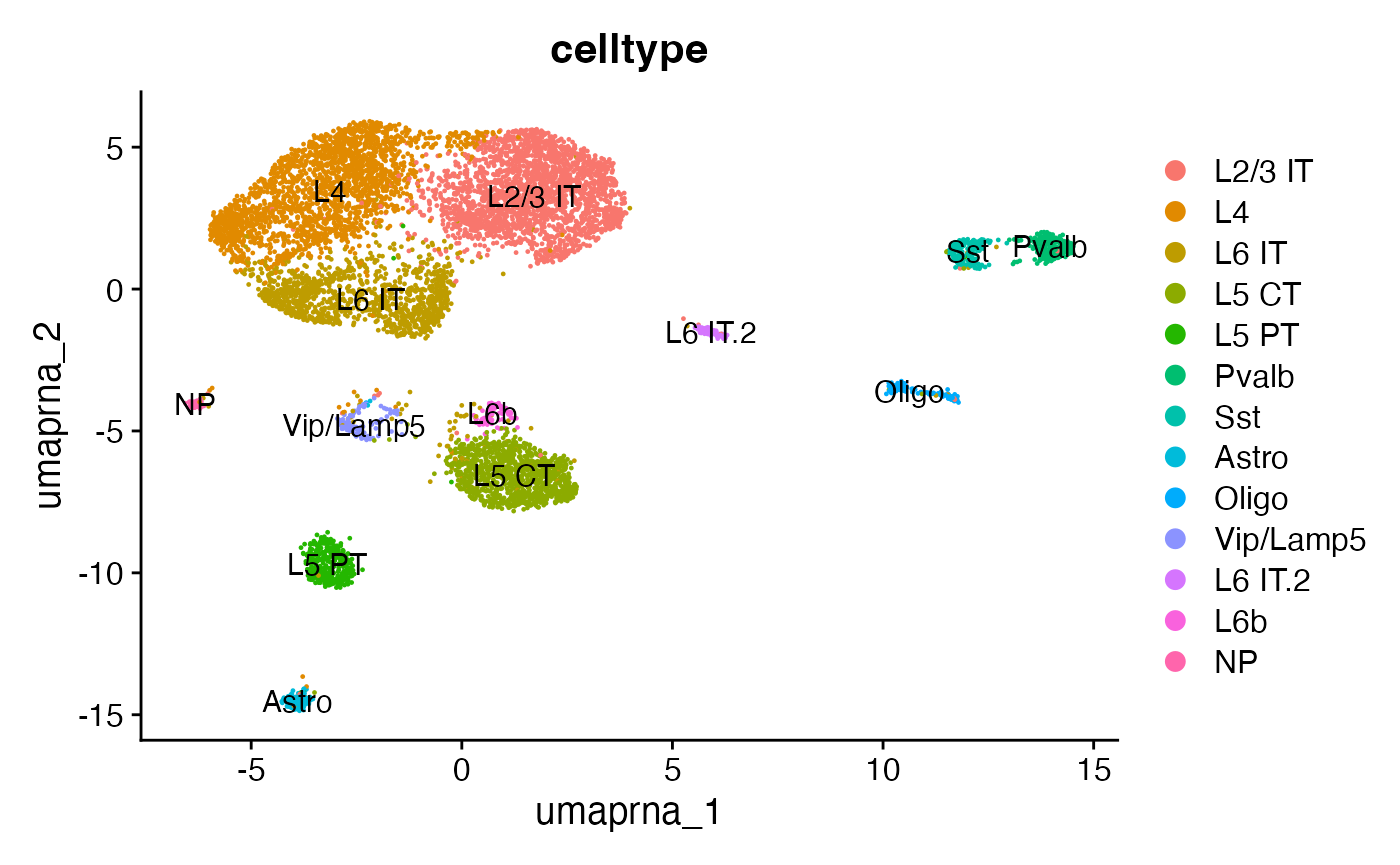
与 scRNA-seq 整合
接下来,可以通过成人小鼠大脑的单细胞RNA测序(scRNA-seq)数据集的标签,来对当前数据集中的细胞类型进行分类标注。
# label transfer from Allen brain
allen <- readRDS("../vignette_data/allen_brain.rds")
allen <- UpdateSeuratObject(allen)

# use the RNA assay in the SNARE-seq data for integration with scRNA-seq
DefaultAssay(snare) <- 'RNA'

transfer.anchors <- FindTransferAnchors(
  reference = allen,
  query = snare,
  dims = 1:30,
  reduction = 'cca'
)

predicted.labels <- TransferData(
  anchorset = transfer.anchors,
  refdata = allen$subclass,
  weight.reduction = snare[['pca']],
  dims = 1:30
)

snare <- AddMetaData(object = snare, metadata = predicted.labels)

# label clusters based on predicted ID
new.cluster.ids <- c(
  "L2/3 IT",
  "L4",
  "L6 IT",
  "L5 CT",
  "L4",
  "L5 PT",
  "Pvalb",
  "Sst",
  "Astro",
  "Oligo",
  "Vip/Lamp5",
  "L6 IT.2",
  "L6b",
  "NP"
)
names(x = new.cluster.ids) <- levels(x = snare)
snare <- RenameIdents(object = snare, new.cluster.ids)
snare$celltype <- Idents(snare)
DimPlot(snare, group.by = 'celltype', label = TRUE, reduction = 'umap.rna')
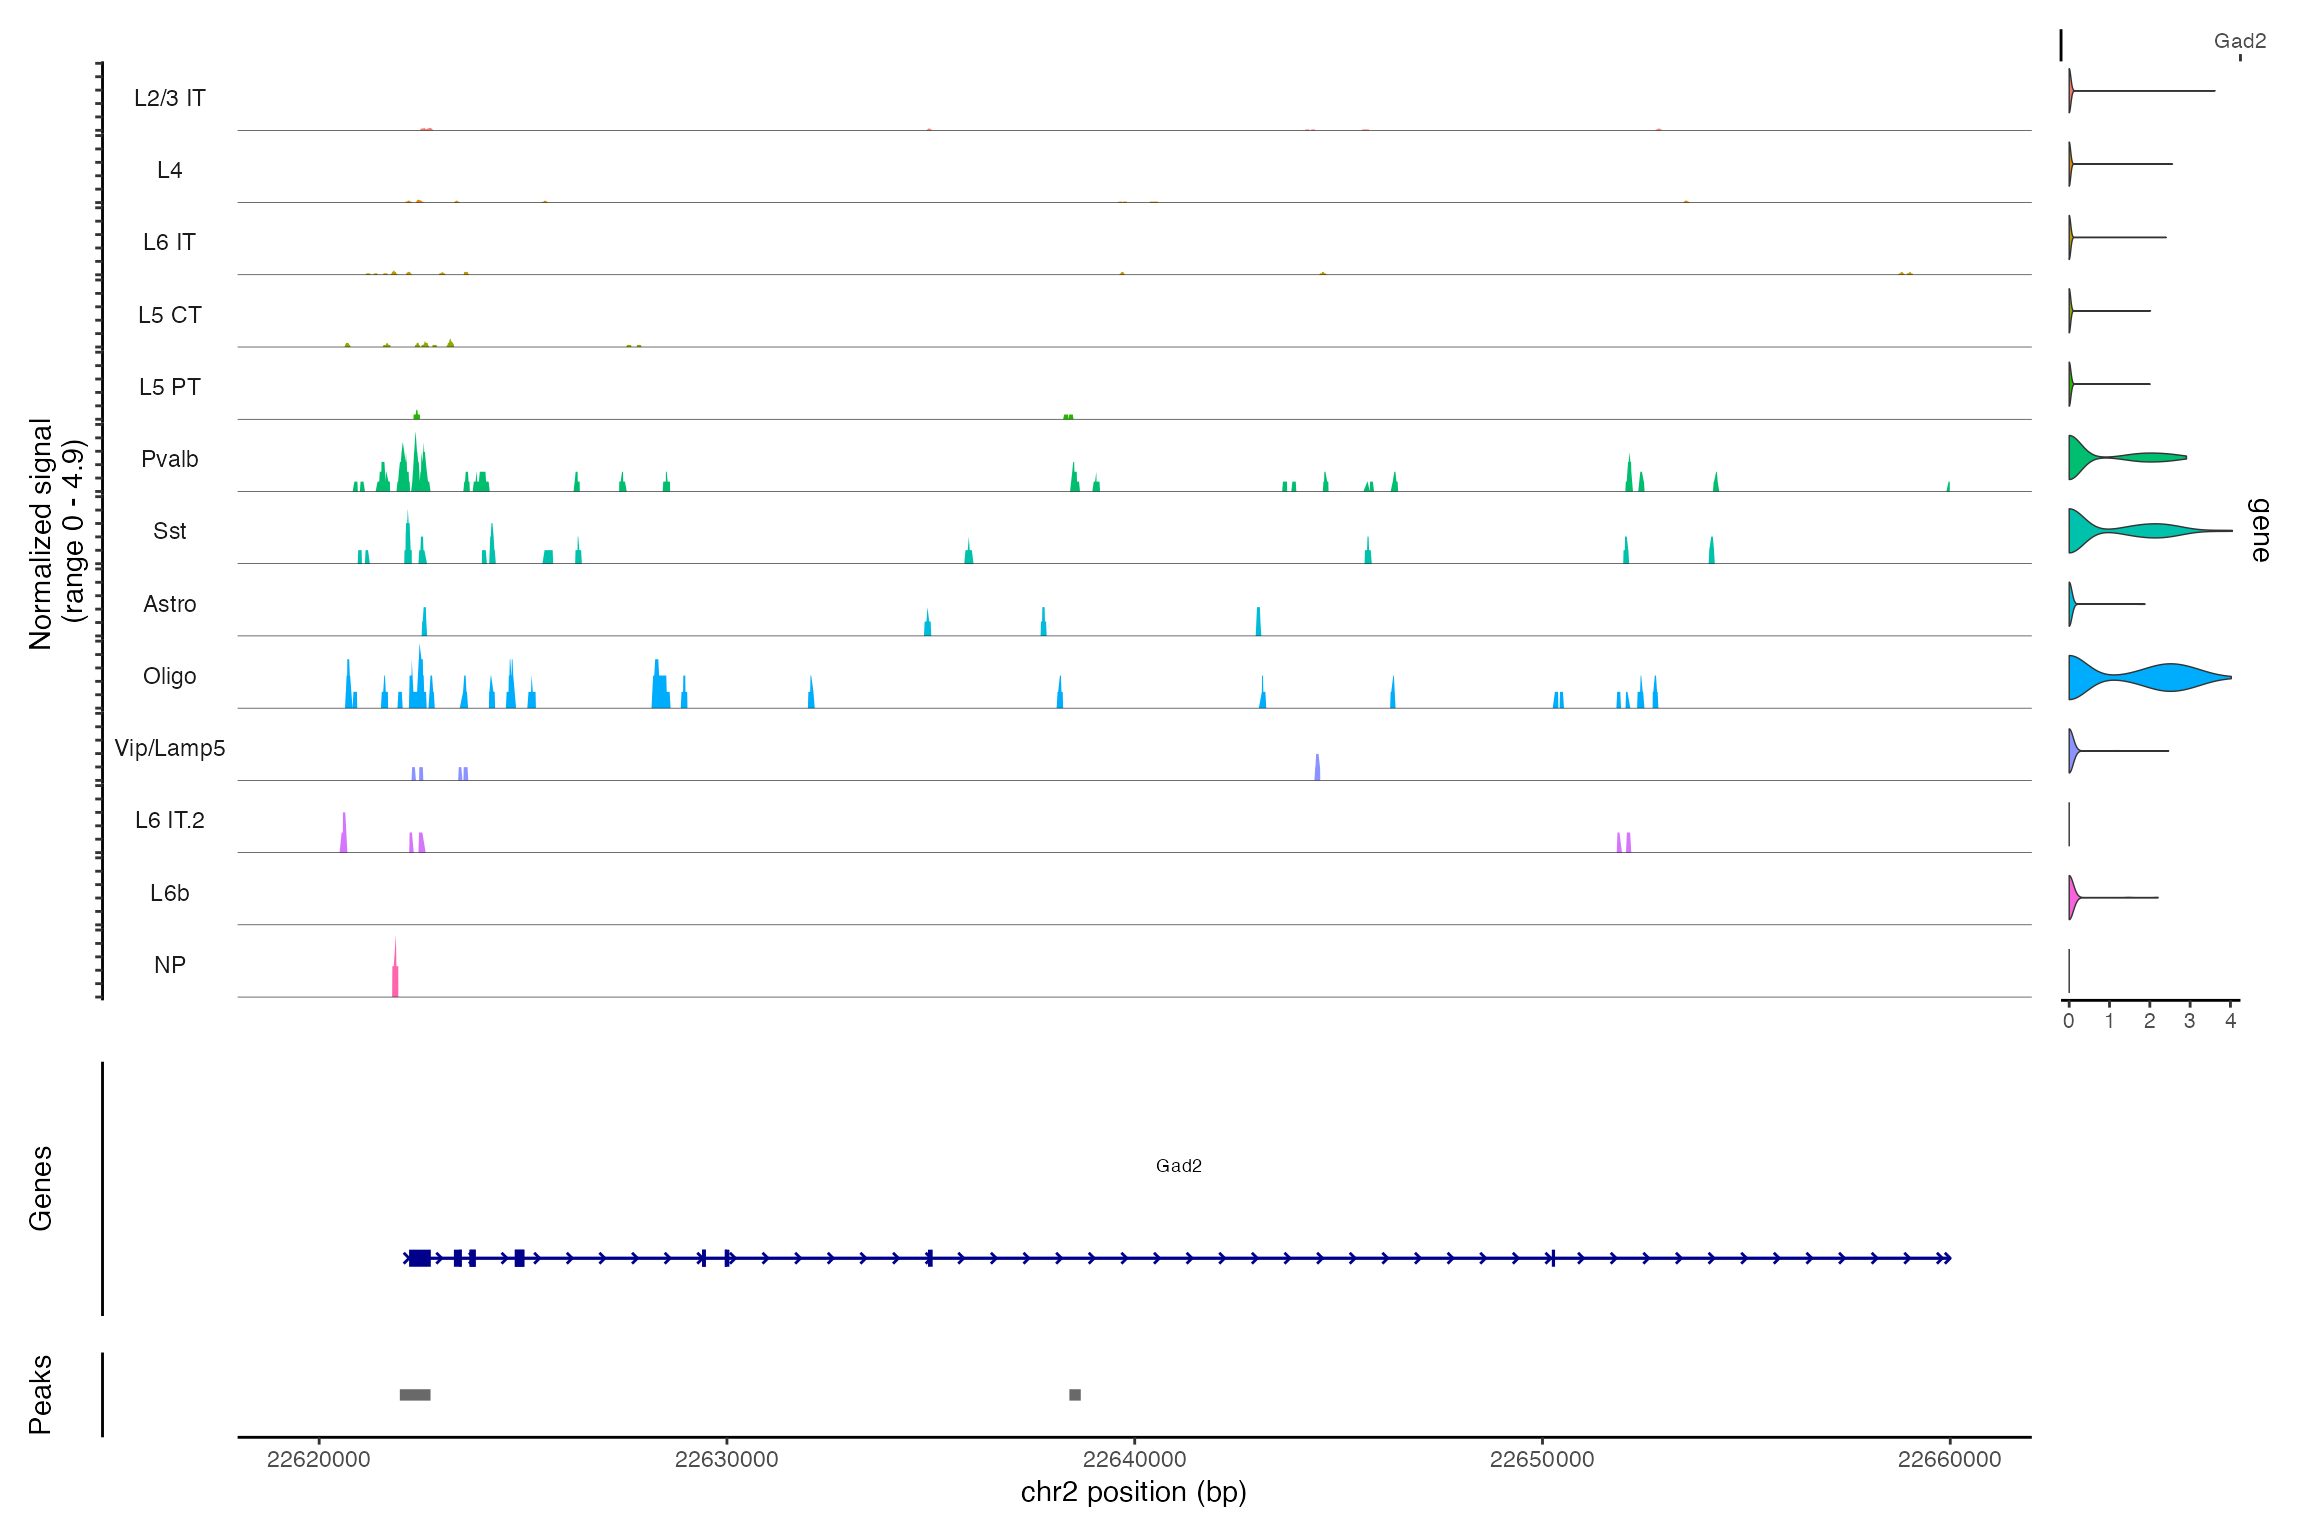
同时展示基因表达和DNA开放性
利用CoveragePlot()功能,我们可以同时观察基因表达和DNA可及性数据。这种方式便于对不同细胞类型在特定区域内的DNA开放性进行比较,并且能够将不同基因的表达情况叠加显示,以便于分析。
DefaultAssay(snare) <- "ATAC"
CoveragePlot(snare, region = "chr2-22620000-22660000", features = "Gad2")
Source: https://stuartlab.org/signac/articles/snareseq
本文由 mdnice 多平台发布


 1121
1121

 被折叠的 条评论
为什么被折叠?
被折叠的 条评论
为什么被折叠?
 到【灌水乐园】发言


