


Prophet是Facebook公司开源的一款时间序列预测模型接口,可用R语言或python进行相关时间预测操作,本文将会从它的代码上对其进行模型拟合以及预测的过程进行一个梳理,并使用python中的pymc包进行Stan文件中贝叶斯建模的复现。
目录
(三)make_all_seasonality_features
一、数据预处理阶段:
此时主要有3个函数进行了数据的预处理以及特征提取操作:
(一)setup_dataframe
这一函数主要是对要进行训练的DataFrame做数据检验及标准化操作:
1、检验DataFrame的时间列以及是否合法
2、检验使用add_regressor函数增加的外部变量是否合法
3、检验使用add_seasonaliy函数增加的季节性因素是否合法
4、重设index并对时间序列数据做标准化
def setup_dataframe(self, df, initialize_scales=False):
    """Prepare dataframe for fitting or predicting.

    Adds a time index and scales y. Creates auxiliary columns 't', 't_ix',
    'y_scaled', and 'cap_scaled'. These columns are used during both
    fitting and predicting.

    Parameters
    ----------
    df: pd.DataFrame with columns ds, y, and cap if logistic growth. Any
        specified additional regressors must also be present.
    initialize_scales: Boolean set scaling factors in self from df.

    Returns
    -------
    pd.DataFrame prepared for fitting or predicting.
    """
    #检验DataFrame的各列是否合法
    if 'y' in df:  # 'y' will be in training data
        df['y'] = pd.to_numeric(df['y'])
        if np.isinf(df['y'].values).any():
            raise ValueError('Found infinity in column y.')
    if df['ds'].dtype == np.int64:
        df['ds'] = df['ds'].astype(str)
    df['ds'] = pd.to_datetime(df['ds'])
    if df['ds'].dt.tz is not None:
        raise ValueError(
            'Column ds has timezone specified, which is not supported. '
            'Remove timezone.'
        )
    if df['ds'].isnull().any():
        raise ValueError('Found NaN in column ds.')
    for name in self.extra_regressors: #add_regressor会增加extra_regressors,表明那一列作为额外的回归量,可以是乘法也可以是加法
        if name not in df:
            raise ValueError(
                'Regressor {name!r} missing from dataframe'
                .format(name=name)
            )
        df[name] = pd.to_numeric(df[name])
        if df[name].isnull().any():
            raise ValueError(
                'Found NaN in column {name!r}'.format(name=name)
            )
    for props in self.seasonalities.values(): #如果没有add_seasonality的话,fit时不会有用,因为这时self.seasonalities没有初始化
        condition_name = props['condition_name']
        if condition_name is not None:
            if condition_name not in df:
                raise ValueError(
                    'Condition {condition_name!r} missing from dataframe'
                    .format(condition_name=condition_name)
                )
            if not df[condition_name].isin([True, False]).all():
                raise ValueError(
                    'Found non-boolean in column {condition_name!r}'
                    .format(condition_name=condition_name)
                )
            df[condition_name] = df[condition_name].astype('bool')

    if df.index.name == 'ds':#重设index
        df.index.name = None
    df = df.sort_values('ds')
    df = df.reset_index(drop=True)

    self.initialize_scales(initialize_scales, df) #对extra_regressor进行标准化做前置准备

    # 进行标准化
    if self.logistic_floor:
        if 'floor' not in df:
            raise ValueError('Expected column "floor".')
    else:
        df['floor'] = 0
    if self.growth == 'logistic':
        if 'cap' not in df:
            raise ValueError(
                'Capacities must be supplied for logistic growth in '
                'column "cap"'
            )
        if (df['cap'] <= df['floor']).any():
            raise ValueError(
                'cap must be greater than floor (which defaults to 0).'
            )
        df['cap_scaled'] = (df['cap'] - df['floor']) / self.y_scale

    df['t'] = (df['ds'] - self.start) / self.t_scale
    if 'y' in df:
        df['y_scaled'] = (df['y'] - df['floor']) / self.y_scale

    for name, props in self.extra_regressors.items():
        df[name] = ((df[name] - props['mu']) / props['std'])
    return df
(二)set_auto_seasonalities
这个函数的作用,是根据数据的时间间隔分别判断是否有Yearly Weekly以及Daily的周期效应并给出内置的对应参数为下一个对季节性因素分解的函数make_all_seasonality_features作准备。
def set_auto_seasonalities(self):
	"""Set seasonalities that were left on auto.

	Turns on yearly seasonality if there is >=2 years of history.
	Turns on weekly seasonality if there is >=2 weeks of history, and the
	spacing between dates in the history is <7 days.
	Turns on daily seasonality if there is >=2 days of history, and the
	spacing between dates in the history is <1 day.
	"""
	first = self.history['ds'].min()
	last = self.history['ds'].max()
	dt = self.history['ds'].diff()
	min_dt = dt.iloc[dt.values.nonzero()[0]].min()

	# Yearly seasonality
	yearly_disable = last - first < pd.Timedelta(days=730)
	fourier_order = self.parse_seasonality_args(
		'yearly', self.yearly_seasonality, yearly_disable, 10)
	if fourier_order > 0:
		self.seasonalities['yearly'] = {
			'period': 365.25,
			'fourier_order': fourier_order,
			'prior_scale': self.seasonality_prior_scale,
			'mode': self.seasonality_mode,
			'condition_name': None
		}

	# Weekly seasonality
	weekly_disable = ((last - first < pd.Timedelta(weeks=2)) or
					  (min_dt >= pd.Timedelta(weeks=1)))
	fourier_order = self.parse_seasonality_args(
		'weekly', self.weekly_seasonality, weekly_disable, 3)
	if fourier_order > 0:
		self.seasonalities['weekly'] = {
			'period': 7,
			'fourier_order': fourier_order,
			'prior_scale': self.seasonality_prior_scale,
			'mode': self.seasonality_mode,
			'condition_name': None
		}

	# Daily seasonality
	daily_disable = ((last - first < pd.Timedelta(days=2)) or
					 (min_dt >= pd.Timedelta(days=1)))
	fourier_order = self.parse_seasonality_args(
		'daily', self.daily_seasonality, daily_disable, 4)
	if fourier_order > 0:
		self.seasonalities['daily'] = {
			'period': 1,
			'fourier_order': fourier_order,
			'prior_scale': self.seasonality_prior_scale,
			'mode': self.seasonality_mode,
			'condition_name': None
		}
(三)make_all_seasonality_features
这个函数就是主要将set_auto_seasonalities中给出的各个季节项信息以及节假日因素作出分解并提取特征。
对于季节项信息,主要是调用fourier_series这个函数对各个不同季节信息对应的series_order与peirod做傅里叶变换,其中sieries_order代表要分解出来的序列数量,而peirod代表了季节对应的周期。
def fourier_series(
	dates: pd.Series,
	period: Union[int, float],
	series_order: int,
) -> NDArray[np.float_]:
	"""Provides Fourier series components with the specified frequency
	and order.

	Parameters
	----------
	dates: pd.Series containing timestamps.
	period: Number of days of the period.
	series_order: Number of components.

	Returns
	-------
	Matrix with seasonality features.
	"""
	if not (series_order >= 1):
		raise ValueError("series_order must be >= 1")

	# convert to days since epoch
	t = dates.to_numpy(dtype=np.int64) // NANOSECONDS_TO_SECONDS / (3600 * 24.)

	x_T = t * np.pi * 2
	fourier_components = np.empty((dates.shape[0], 2 * series_order))
	for i in range(series_order):
		c = x_T * (i + 1) / period
		fourier_components[:, 2 * i] = np.sin(c)
		fourier_components[:, (2 * i) + 1] = np.cos(c)
	return fourier_components
此处简单举个例子:
Prophet自带的Yearly参数为例,其中sieries_order为10,代表要分解出10个序列;period为365.25,表示一个周期的长度(也就是频率)为365.25。此处使用的傅里叶级数公式为:
其中,t为标准化到“日”的时间点信息,p为period,是个固定值,而n就代表了当前的series_order,从1到10不等,可以看做是傅里叶级数的阶数。将其正弦项和余弦项作图打印出来,如图所示: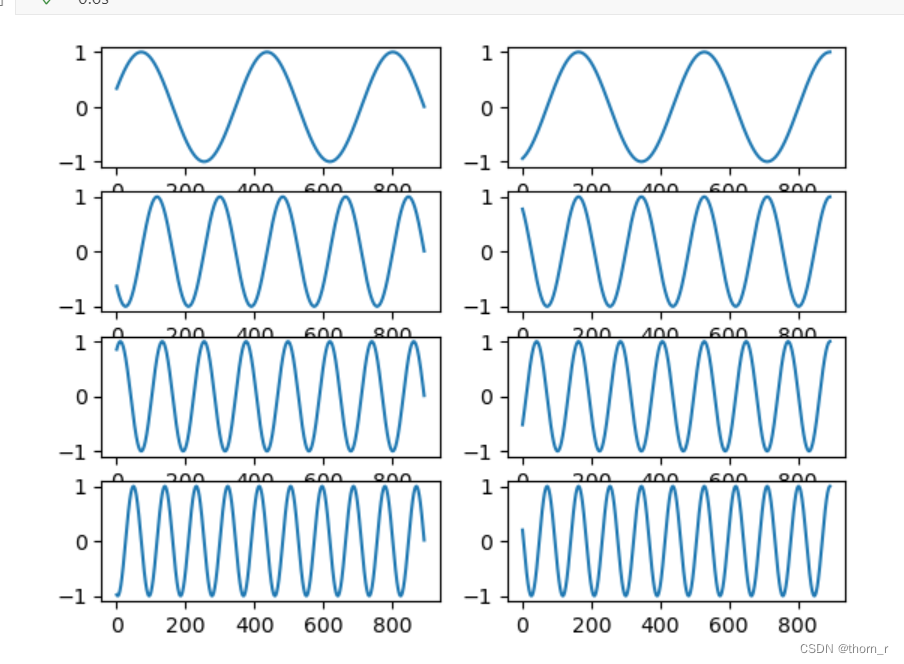
最终,能够得到20个关于年份的正弦/余弦函数特征。
而对于节假日信息的处理则较为简单,就是单纯地对每个节假日的时间点以及我们在初始化时填写的"upper_window"与"lower_window"的偏移量的位置做0-1变量特征:
def make_holiday_features(self, dates, holidays):
"""Construct a dataframe of holiday features.
Parameters
----------
dates: pd.Series containing timestamps used for computing seasonality.
holidays: pd.Dataframe containing holidays, as returned by
construct_holiday_dataframe.
Returns
-------
holiday_features: pd.DataFrame with a column for each holiday.
prior_scale_list: List of prior scales for each holiday column.
holiday_names: List of names of holidays
"""
# Holds columns of our future matrix.
expanded_holidays = defaultdict(lambda: np.zeros(dates.shape[0]))
prior_scales = {}
# Makes an index so we can perform `get_loc` below.
# Strip to just dates.
row_index = pd.DatetimeIndex(dates.dt.date)
for row in holidays.itertuples():
dt = row.ds.date()
try:
lw = int(getattr(row, 'lower_window', 0))
uw = int(getattr(row, 'upper_window', 0))
except ValueError:
lw = 0
uw = 0
ps = float(getattr(row, 'prior_scale', self.holidays_prior_scale))
if np.isnan(ps):
ps = float(self.holidays_prior_scale)
if row.holiday in prior_scales and prior_scales[row.holiday] != ps:
raise ValueError(
'Holiday {holiday!r} does not have consistent prior '
'scale specification.'.format(holiday=row.holiday)
)
if ps <= 0:
raise ValueError('Prior scale must be > 0')
prior_scales[row.holiday] = ps
for offset in range(lw, uw + 1):
occurrence = pd.to_datetime(dt + timedelta(days=offset))
try:
loc = row_index.get_loc(occurrence)
except KeyError:
loc = None
key = '{}_delim_{}{}'.format(
row.holiday,
'+' if offset >= 0 else '-',
abs(offset)
)
if loc is not None:
expanded_holidays[key][loc] = 1.
else:
expanded_holidays[key] # Access key to generate value
holiday_features = pd.DataFrame(expanded_holidays)
# Make sure column order is consistent
holiday_features = holiday_features[sorted(holiday_features.columns
.tolist())]
prior_scale_list = [
prior_scales[h.split('_delim_')[0]]
for h in holiday_features.columns
]
holiday_names = list(prior_scales.keys())
# Store holiday names used in fit
if self.train_holiday_names is None:
self.train_holiday_names = pd.Series(holiday_names)
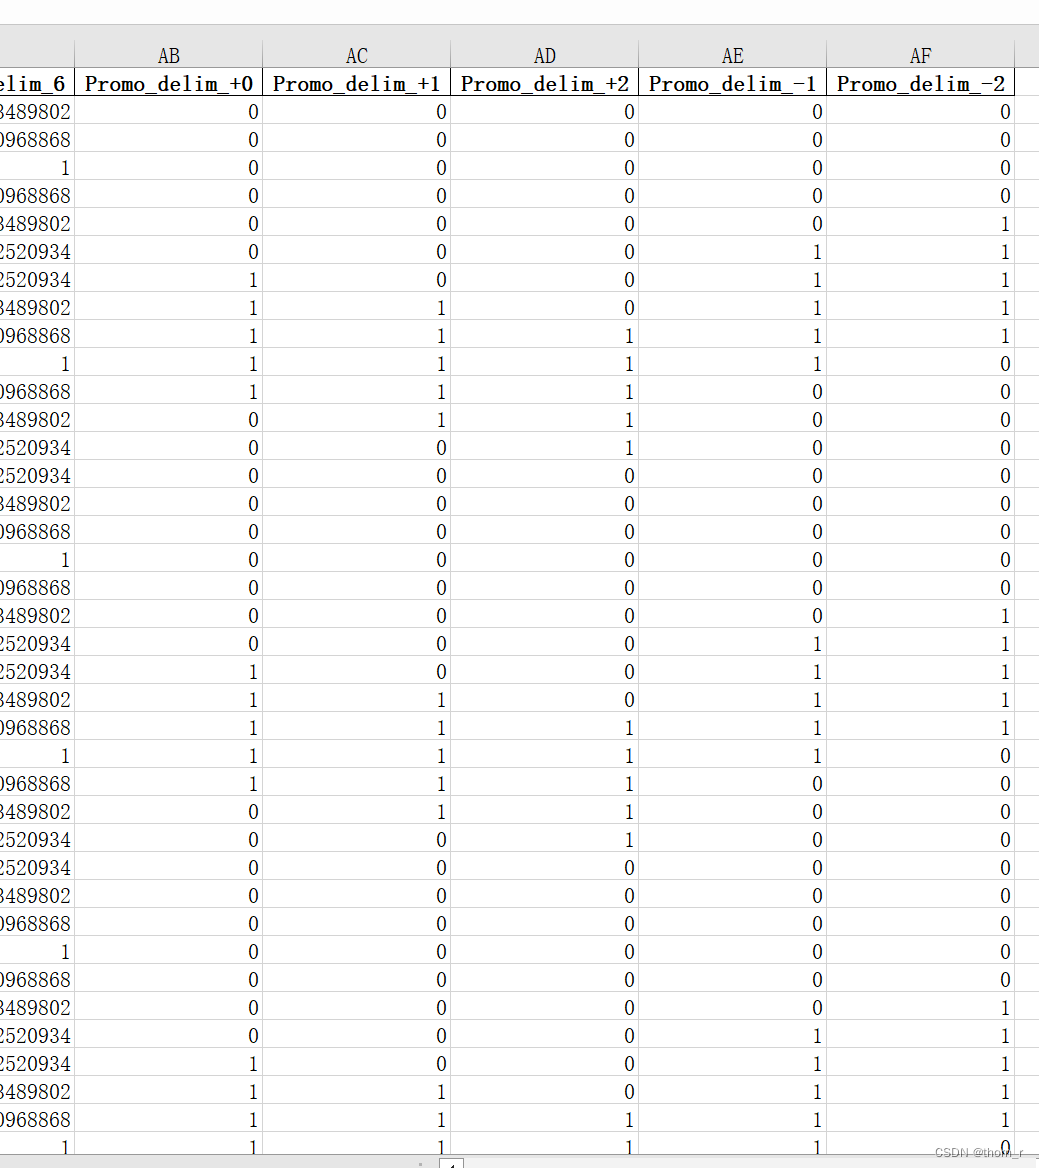
return holiday_features, prior_scale_list, holiday_names举个简单的例子,我们将店铺促销的日子作为Holiday传入模型,upper_window与lower_window设置为2,最后模型的特征就会增加5列,分别是:是否当日为促销,是否当日为促销前1天/前2天/后1天/后2天
holiday_df = pd.DataFrame({
    "holiday":"Promo",
    "ds":tmp[tmp.Promo==1].Date,
    "upper_window":2,
    "lower_window":-2
})
最终,将傅里叶级数的季节性因素、节假日因素以及使用add_aggressor添加的外部因素3个的特征融合,获得特征矩阵。
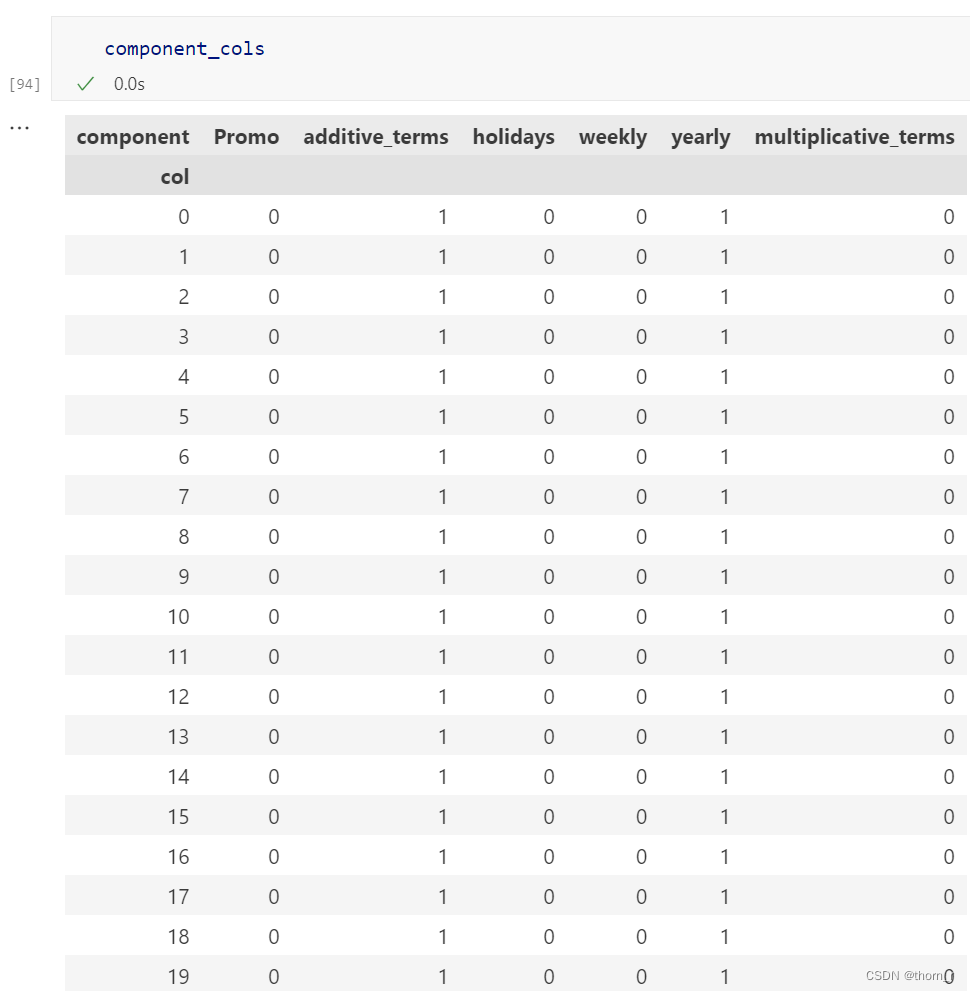
除此之外,还有一个regressor_column_matrix函数,用以表示特征矩阵的哪些列对应于哪些季节性/回归分量的数据框。
def regressor_column_matrix(self, seasonal_features, modes):
	"""Dataframe indicating which columns of the feature matrix correspond
	to which seasonality/regressor components.

	Includes combination components, like 'additive_terms'. These
	combination components will be added to the 'modes' input.

	Parameters
	----------
	seasonal_features: Constructed seasonal features dataframe
	modes: Dictionary with keys 'additive' and 'multiplicative' listing the
		component names for each mode of seasonality.

	Returns
	-------
	component_cols: A binary indicator dataframe with columns seasonal
		components and rows columns in seasonal_features. Entry is 1 if
		that columns is used in that component.
	modes: Updated input with combination components.
	"""
	components = pd.DataFrame({
		'col': np.arange(seasonal_features.shape[1]),
		'component': [
			x.split('_delim_')[0] for x in seasonal_features.columns
		],
	})
	# Add total for holidays
	if self.train_holiday_names is not None:
		components = self.add_group_component(
			components, 'holidays', self.train_holiday_names.unique())
	# Add totals additive and multiplicative components, and regressors #将所有的holiday视作同一效应作为holiday的total效应,下additive与multiplicative相同
	for mode in ['additive', 'multiplicative']:
		components = self.add_group_component(
			components, mode + '_terms', modes[mode]
		)
		regressors_by_mode = [
			r for r, props in self.extra_regressors.items()
			if props['mode'] == mode
		]
		components = self.add_group_component(
			components, 'extra_regressors_' + mode, regressors_by_mode)
		# Add combination components to modes
		modes[mode].append(mode + '_terms')
		modes[mode].append('extra_regressors_' + mode)
	# After all of the additive/multiplicative groups have been added,
	modes[self.seasonality_mode].append('holidays')
	# Convert to a binary matrix 将components表转置成为0-1变量的查询表
	component_cols = pd.crosstab(
		components['col'], components['component'],
	).sort_index(level='col')
	# Add columns for additive and multiplicative terms, if missing
	for name in ['additive_terms', 'multiplicative_terms']:
		if name not in component_cols:
			component_cols[name] = 0
	# Remove the placeholder
	component_cols.drop('zeros', axis=1, inplace=True, errors='ignore')
	# Validation
	if (max(component_cols['additive_terms']
		+ component_cols['multiplicative_terms']) > 1):
		raise Exception('A bug occurred in seasonal components.')
	# Compare to the training, if set.
	if self.train_component_cols is not None:
		component_cols = component_cols[self.train_component_cols.columns]
		if not component_cols.equals(self.train_component_cols):
			raise Exception('A bug occurred in constructing regressors.')
	return component_cols, modes
完整代码如下:
def make_all_seasonality_features(self, df):
	"""Dataframe with seasonality features.

	Includes seasonality features, holiday features, and added regressors.

	Parameters
	----------
	df: pd.DataFrame with dates for computing seasonality features and any
		added regressors.

	Returns
	-------
	pd.DataFrame with regression features.
	list of prior scales for each column of the features dataframe.
	Dataframe with indicators for which regression components correspond to
		which columns.
	Dictionary with keys 'additive' and 'multiplicative' listing the
		component names for each mode of seasonality.
	"""
	seasonal_features = []
	prior_scales = []
	modes = {'additive': [], 'multiplicative': []}

	# Seasonality features #傅里叶变换分解yearly weekly daily等周期信息,在固定的Period(周期)内,输入的X值每个周期是一样的
	for name, props in self.seasonalities.items():
		features = self.make_seasonality_features(
			df['ds'],
			props['period'],
			props['fourier_order'],
			name,
		)
		if props['condition_name'] is not None:
			features[~df[props['condition_name']]] = 0
		seasonal_features.append(features)
		prior_scales.extend(
			[props['prior_scale']] * features.shape[1])
		modes[props['mode']].append(name)

	# Holiday features
	holidays = self.construct_holiday_dataframe(df['ds'])
	if len(holidays) > 0:
		features, holiday_priors, holiday_names = (
			self.make_holiday_features(df['ds'], holidays)
		)
		seasonal_features.append(features)
		prior_scales.extend(holiday_priors)
		modes[self.seasonality_mode].extend(holiday_names)

	# Additional regressors
	for name, props in self.extra_regressors.items():
		seasonal_features.append(pd.DataFrame(df[name]))
		prior_scales.append(props['prior_scale'])
		modes[props['mode']].append(name)

	# Dummy to prevent empty X 如果什么seasonal feature也没的话,会自己加一个全零的dummy feature
	if len(seasonal_features) == 0:
		seasonal_features.append(
			pd.DataFrame({'zeros': np.zeros(df.shape[0])}))
		prior_scales.append(1.)

	seasonal_features = pd.concat(seasonal_features, axis=1)
	component_cols, modes = self.regressor_column_matrix(
		seasonal_features, modes
	)
	return seasonal_features, prior_scales, component_cols, modes
此外还有一个set_changepoints函数,实际上就是将训练的时间点等分切割,每一段距离上设一个changepoint。
二、贝叶斯建模
Prophet使用stan语言做贝叶斯建模,即将未知数(如回归系数)视为符合某个分布的随机变量,使用采样方法来预估未知数。Stan代码如下:
// Copyright (c) Facebook, Inc. and its affiliates.

// This source code is licensed under the MIT license found in the
// LICENSE file in the root directory of this source tree.

functions {
  matrix get_changepoint_matrix(vector t, vector t_change, int T, int S) {
    // Assumes t and t_change are sorted.
    matrix[T, S] A;
    row_vector[S] a_row;
    int cp_idx;

    // Start with an empty matrix.
    A = rep_matrix(0, T, S);
    a_row = rep_row_vector(0, S);
    cp_idx = 1;

    // Fill in each row of A.
    for (i in 1:T) {
      while ((cp_idx <= S) && (t[i] >= t_change[cp_idx])) {
        a_row[cp_idx] = 1;
        cp_idx = cp_idx + 1;
      }
      A[i] = a_row;
    }
    return A;
  }

  // Logistic trend functions

  vector logistic_gamma(real k, real m, vector delta, vector t_change, int S) {
    vector[S] gamma;  // adjusted offsets, for piecewise continuity
    vector[S + 1] k_s;  // actual rate in each segment
    real m_pr;

    // Compute the rate in each segment
    k_s = append_row(k, k + cumulative_sum(delta));

    // Piecewise offsets
    m_pr = m; // The offset in the previous segment
    for (i in 1:S) {
      gamma[i] = (t_change[i] - m_pr) * (1 - k_s[i] / k_s[i + 1]);
      m_pr = m_pr + gamma[i];  // update for the next segment
    }
    return gamma;
  }

  vector logistic_trend(
    real k,
    real m,
    vector delta,
    vector t,
    vector cap,
    matrix A,
    vector t_change,
    int S
  ) {
    vector[S] gamma;

    gamma = logistic_gamma(k, m, delta, t_change, S);
    return cap .* inv_logit((k + A * delta) .* (t - (m + A * gamma)));
  }

  // Linear trend function

  vector linear_trend(
    real k,
    real m,
    vector delta,
    vector t,
    matrix A,
    vector t_change
  ) {
    return (k + A * delta) .* t + (m + A * (-t_change .* delta));
  }

  // Flat trend function

  vector flat_trend(
    real m,
    int T
  ) {
    return rep_vector(m, T);
  }
}

data {
  int T;                // Number of time periods
  int<lower=1> K;       // Number of regressors
  vector[T] t;          // Time
  vector[T] cap;        // Capacities for logistic trend
  vector[T] y;          // Time series
  int S;                // Number of changepoints
  vector[S] t_change;   // Times of trend changepoints
  matrix[T,K] X;        // Regressors
  vector[K] sigmas;     // Scale on seasonality prior
  real<lower=0> tau;    // Scale on changepoints prior
  int trend_indicator;  // 0 for linear, 1 for logistic, 2 for flat
  vector[K] s_a;        // Indicator of additive features
  vector[K] s_m;        // Indicator of multiplicative features
}

transformed data {
  matrix[T, S] A = get_changepoint_matrix(t, t_change, T, S);
  matrix[T, K] X_sa = X .* rep_matrix(s_a', T);
  matrix[T, K] X_sm = X .* rep_matrix(s_m', T);
}

parameters {
  real k;                   // Base trend growth rate
  real m;                   // Trend offset
  vector[S] delta;          // Trend rate adjustments
  real<lower=0> sigma_obs;  // Observation noise
  vector[K] beta;           // Regressor coefficients
}

transformed parameters {
  vector[T] trend;
  if (trend_indicator == 0) {
    trend = linear_trend(k, m, delta, t, A, t_change);
  } else if (trend_indicator == 1) {
    trend = logistic_trend(k, m, delta, t, cap, A, t_change, S);
  } else if (trend_indicator == 2) {
    trend = flat_trend(m, T);
  }
}

model {
  //priors
  k ~ normal(0, 5);
  m ~ normal(0, 5);
  delta ~ double_exponential(0, tau);
  sigma_obs ~ normal(0, 0.5);
  beta ~ normal(0, sigmas);

  // Likelihood
  y ~ normal_id_glm(
    X_sa,
    trend .* (1 + X_sm * beta),
    beta,
    sigma_obs
  );
}
其中,data为我们输入的数据,transformed_data表示对数据进行的变换,parameters为我们要拟合的模型参数,transformed_parameters表示我们对模型参数进行组合变换后得到的新参数。
Stan中使用的模型为广义线性模型,公式为:
其中,X对应X_sa,表示seasonality中addictive类的分量。
而α对应trend.*(1+X_sm*beta) 注意Stan中的.*表示2个矩阵对应元素相乘,*代表元素相乘,这一点和numpy正好相反。X_sm为seasonality中multiplicative类的分量,beta为我们要拟合的变量,trend是根据我们模型设置的趋势项是linear还是logistics等来决定的,以linear为例,此处trend为
(k + A * delta) .* t + (m + A * (-t_change .* delta)) k,delta和m使我们要拟合的变量,t_change是changepoint对应的标准化后的时间,A为所有t个时间点上,当前时间点是否为changepoint的矩阵,举个简单的例子就是[0,0,0,0]代表当前时间点不是changepoint,[0,0,1,0]代表当前时间点为第三个changepointpoint。
β对应的就是拟合的变量beta;σ对应sigma_obs,代表残差项。使用pymc做拟合,得到python版本的代码:
class prophet_model:
    def __init__(self,dat) -> None:
        self.dat = dat
        #transformed data
        self.A = self.get_changepoint_matrix(dat['t'],dat['t_change'],dat['T'],dat['S'])
        self.X_sa = dat['X'] * \
                  np.repeat(dat["s_a"].values,dat["T"]).reshape(len(dat['s_a']),dat['T']).T
        self.X_sm = dat['X'] * \
                  np.repeat(dat["s_m"].values,dat["T"]).reshape(len(dat['s_m']),dat['T']).T
        #transformed parameters

    def transform_paras(self,k,m,delta):
        dat = self.dat
        if dat['trend_indicator'] == 0:
            trend = self.linear_trend(k,m,delta,dat['t'],self.A,dat['t_change'])
        elif dat['trend_indicator'] == 1:
            trend = self.logistic_trend(k,m,delta,dat['t'],dat['cap'],self.A,dat['t_change'],dat['S'])
        elif dat['trend_indicator'] == 2:
            trend = self.flat_trend(m,dat['T'])
        return trend


    def fit(self):
        dat = self.dat
        model = pm.Model()
        with model:
            k = pm.Normal('k',mu=0,sigma=5)
            m = pm.Normal('m',mu=0,sigma=5)
            delta = pm.Laplace('delta',mu=0,b=dat['tau'],shape=dat['S'])
            sigma_obs = pm.HalfNormal('sigma_obs',sigma=0.5)
            beta = pm.Normal("beta",0,np.array(dat["sigmas"]))
            alpha = (pm.math.dot(self.X_sm,beta)+pm.math.ones_like(pm.math.dot(self.X_sm,beta)))*self.transform_paras(k,m,delta)
            mu = alpha + pm.math.dot(self.X_sa,beta)
            Y_obs = pm.Normal("obs",observed=dat["y"],mu=mu,sigma=sigma_obs)
        map_estimate = pm.find_MAP(model=model,start=stan_init)
        return map_estimate,model

    def get_changepoint_matrix(self,t,t_change,T,S):
        A = np.zeros([T,S])

        j=0
        for i in range(T):
            while j<S and t[i]>=t_change[j]:
                A[i][j]=1
                j+=1
        return A

    def logistic_gamma(self,k,m,delta,t_change,S):
        # gamma:调整偏移量,以实现分段连续性
        # k_s:每段的实际“速率”
        k_s = np.cumsum(delta)+k
        k_s = np.concatenate([k,k_s])
        gamma = np.zeros(S)

        m_pr = m
        for i in range(S):
            gamma[i] = (t_change[i]-m_pr)*(1 - k_s[i] / k_s[i + 1])
            m_pr += gamma[i]
        return gamma

    def linear_trend(self,k,m,delta,t,A,t_change):
        return (k+pm.math.dot(A,delta)*t)+(m+pm.math.dot(A,(-t_change*delta)))

    def logistic_trend(self,k,m,delta,t,cap,A,t_change,S):
        gamma = self.logistic_gamma(k, m, delta, t_change, S)
        def inv_logit(x):
            return 1/(1+np.exp(-x))
        return cap*inv_logit(k+A*delta)*(t-(m+A*gamma))

    def flat_trend(self,m,T):
        return np.repeat([m],T)
其中stan_init变量为prophet在python中初始化的kinit变量,但实际上按照贝叶斯建模的逻辑,这个初始化的值应该是不影响最终得到的结果的。
Prophet的fit函数如下,为了获取dat参数,我将后面传入stan模型的那部分函数注释了起来。
ef fit(self, df, **kwargs):
	"""Fit the Prophet model.

	This sets self.params to contain the fitted model parameters. It is a
	dictionary parameter names as keys and the following items:
		k (Mx1 array): M posterior samples of the initial slope.
		m (Mx1 array): The initial intercept.
		delta (MxN array): The slope change at each of N changepoints.
		beta (MxK matrix): Coefficients for K seasonality features.
		sigma_obs (Mx1 array): Noise level.
	Note that M=1 if MAP estimation.

	Parameters
	----------
	df: pd.DataFrame containing the history. Must have columns ds (date
		type) and y, the time series. If self.growth is 'logistic', then
		df must also have a column cap that specifies the capacity at
		each ds.
	kwargs: Additional arguments passed to the optimizing or sampling
		functions in Stan.

	Returns
	-------
	The fitted Prophet object.
	"""
	if self.history is not None:
		raise Exception('Prophet object can only be fit once. '
						'Instantiate a new object.')
	if ('ds' not in df) or ('y' not in df):
		raise ValueError(
			'Dataframe must have columns "ds" and "y" with the dates and '
			'values respectively.'
		)
	history = df[df['y'].notnull()].copy()
	if history.shape[0] < 2:
		raise ValueError('Dataframe has less than 2 non-NaN rows.')
	self.history_dates = pd.to_datetime(pd.Series(df['ds'].unique(), name='ds')).sort_values()

	history = self.setup_dataframe(history, initialize_scales=True) #重设index并做标准化
	self.history = history
	self.set_auto_seasonalities() #此处设置auto了,就代表实际上已经是将默认参数放到模型中,只不过这个函数会挨个判断有没有Daily Weekly Yearly的属性
	seasonal_features, prior_scales, component_cols, modes = (
		self.make_all_seasonality_features(history))
	self.train_component_cols = component_cols
	self.component_modes = modes
	self.fit_kwargs = deepcopy(kwargs)

	self.set_changepoints() #此处的change_points就是在前面changepoint_range范围内,将等距离取n_changepoints个点

	trend_indicator = {'linear': 0, 'logistic': 1, 'flat': 2}

	dat = {
		'T': history.shape[0],
		'K': seasonal_features.shape[1],
		'S': len(self.changepoints_t),
		'y': history['y_scaled'],
		't': history['t'],
		't_change': self.changepoints_t,
		'X': seasonal_features,
		'sigmas': prior_scales,
		'tau': self.changepoint_prior_scale,
		'trend_indicator': trend_indicator[self.growth],
		's_a': component_cols['additive_terms'],
		's_m': component_cols['multiplicative_terms'],
	}

	if self.growth == 'linear':
		dat['cap'] = np.zeros(self.history.shape[0])
		kinit = self.linear_growth_init(history)
	elif self.growth == 'flat':
		dat['cap'] = np.zeros(self.history.shape[0])
		kinit = self.flat_growth_init(history)
	else:
		dat['cap'] = history['cap_scaled']
		kinit = self.logistic_growth_init(history)

	stan_init = {
		'k': kinit[0],
		'm': kinit[1],
		'delta': np.zeros(len(self.changepoints_t)),
		'beta': np.zeros(seasonal_features.shape[1]),
		'sigma_obs': 1,
	}

	return stan_init, dat, kwargs

#         if history['y'].min() == history['y'].max() and \
#                 (self.growth == 'linear' or self.growth == 'flat'):
#             self.params = stan_init
#             self.params['sigma_obs'] = 1e-9
#             for par in self.params:
#                 self.params[par] = np.array([self.params[par]])
#         elif self.mcmc_samples > 0:
#             self.params = self.stan_backend.sampling(stan_init, dat, self.mcmc_samples, **kwargs)
#         else:
#             self.params = self.stan_backend.fit(stan_init, dat, **kwargs)

#         self.stan_fit = self.stan_backend.stan_fit
#         # If no changepoints were requested, replace delta with 0s
#         if len(self.changepoints) == 0:
#             # Fold delta into the base rate k
#             self.params['k'] = (
#                 self.params['k'] + self.params['delta'].reshape(-1)
#             )
#             self.params['delta'] = (np.zeros(self.params['delta'].shape)
#                                       .reshape((-1, 1)))

#         return self
三、预测
prophet在预测时需要使用make_future_dataframe函数来指定预测未来多少天;实际上就是将时间点从预测的时间段延长到未来的那个日期,模型本身的预测必须将他们一并预测出来,无法割裂地只预测未来n天。
模型将季节性因素(包括节假日)和趋势项个因素分别作预测:
(一)、趋势项
此处以linear_growth(线性增长)为例(不知道为什么,我跑logistics增长会卡死,一直跑不出结果出来)。本质上就是根据changepoint将时间线切割成n块,得到一个阶梯形的举证,使用训练好的delta来作为权重矩阵相乘再加k,获得“每个changepoints到changepoints时间段”上的权重。最后再加上偏移量m,得到趋势项的预测。
def piecewise_linear(t, deltas, k, m, changepoint_ts):
	"""Evaluate the piecewise linear function.

	Parameters
	----------
	t: np.array of times on which the function is evaluated.
	deltas: np.array of rate changes at each changepoint.
	k: Float initial rate.
	m: Float initial offset.
	changepoint_ts: np.array of changepoint times.

	Returns
	-------
	Vector y(t).
	"""
	deltas_t = (changepoint_ts[None, :] <= t[..., None]) * deltas #[None, :]将(25,)变形为(1,25) t[..., None]将(942,)变形为(942,1) 最终的形状为(942, 25),每行代表当前时间是否“经过了”25个changepoints的时间点;应当是阶梯矩阵,最终将他们乘以deltas
	k_t = deltas_t.sum(axis=1) + k
	m_t = (deltas_t * -changepoint_ts).sum(axis=1) + m
	return k_t * t + m_t
(二)、季节因素
使用前文的make_all_seasonality_features所得出的各个component 0-1分量来筛选beta。对每个分量进行预测。不过要注意的是,再component中,只有"additive_terms"和"multiplicative_terms"这2个汇总的分量会被算入最后的yhat中,尽管某些列由于有汇总多算了几遍,但实际上并结果并不会因此多出。
def predict_seasonal_components(self, df):
	"""Predict seasonality components, holidays, and added regressors.

	Parameters
	----------
	df: Prediction dataframe.

	Returns
	-------
	Dataframe with seasonal components.
	"""
	seasonal_features, _, component_cols, _ = (
		self.make_all_seasonality_features(df)
	)
	if self.uncertainty_samples:
		lower_p = 100 * (1.0 - self.interval_width) / 2
		upper_p = 100 * (1.0 + self.interval_width) / 2

	X = seasonal_features.values
	data = {}
	for component in component_cols.columns:
		beta_c = self.params['beta'] * component_cols[component].values

		comp = np.matmul(X, beta_c.transpose())
		if component in self.component_modes['additive']:
			comp *= self.y_scale
		data[component] = np.nanmean(comp, axis=1)
		if self.uncertainty_samples:
			data[component + '_lower'] = self.percentile(
				comp, lower_p, axis=1,
			)
			data[component + '_upper'] = self.percentile(
				comp, upper_p, axis=1,
			)
	return pd.DataFrame(data)
最终,我们将addictive,multiplicative和trend三者结合,获得最终的预测结果。
def predict(self, df: pd.DataFrame = None, vectorized: bool = True) -> pd.DataFrame:
	"""Predict using the prophet model.

	Parameters
	----------
	df: pd.DataFrame with dates for predictions (column ds), and capacity
		(column cap) if logistic growth. If not provided, predictions are
		made on the history.
	vectorized: Whether to use a vectorized method to compute uncertainty intervals. Suggest using
		True (the default) for much faster runtimes in most cases,
		except when (growth = 'logistic' and mcmc_samples > 0).

	Returns
	-------
	A pd.DataFrame with the forecast components.
	"""
	if self.history is None:
		raise Exception('Model has not been fit.')

	if df is None:
		df = self.history.copy()
	else:
		if df.shape[0] == 0:
			raise ValueError('Dataframe has no rows.')
		df = self.setup_dataframe(df.copy())

	df['trend'] = self.predict_trend(df)
	seasonal_components = self.predict_seasonal_components(df)
	if self.uncertainty_samples:
		intervals = self.predict_uncertainty(df, vectorized)
	else:
		intervals = None

	# Drop columns except ds, cap, floor, and trend
	cols = ['ds', 'trend']
	if 'cap' in df:
		cols.append('cap')
	if self.logistic_floor:
		cols.append('floor')
	# Add in forecast components
	df2 = pd.concat((df[cols], intervals, seasonal_components), axis=1)
	df2['yhat'] = (
			df2['trend'] * (1 + df2['multiplicative_terms'])
			+ df2['additive_terms']
	)
	return df2
四、pymc模型效果实验
此处拿kaggle上的rossmann数据集中的某一家店铺做实验,代码如下:
data = pd.read_pickle("train.pkl")
data = data[["Store","Date","Open","Promo","Sales"]]
sc = StandardScaler()
tmp = data[data.Store == 618]
tmp.Sales = tmp.Sales.replace(0,np.nan)
tmp.Sales = sc.fit_transform(tmp.Sales.values.reshape(-1, 1)).flatten()
tmp.head()
holiday_df = pd.DataFrame({
    "holiday":"Promo",
    "ds":tmp[tmp.Promo==1].Date,
    "upper_window":2,
    "lower_window":-2
})
tmp = tmp.rename({"Date":"ds","Sales":"y"},axis=1)

prophet_test = Prophet(holidays=holiday_df)
df_to_fit = tmp[tmp.ds<=max(tmp.ds)-pd.Timedelta("48 days")]
valid = tmp[tmp.ds>max(tmp.ds)-pd.Timedelta("48 days")]

stan_init, dat, kwargs = prophet_test.fit(df_to_fit)

stan_model = prophet_model(dat)
res_paras,model = stan_model.fit()

#此处params有部分参数需要加一个维度,故而手动赋值

prophet_test.params = {'k': np.array([0.17607271]),
 'm': np.array([-0.28650166]),
 'delta': np.array([ 3.83468394e-10,  3.83468394e-10,  3.83468394e-10,  3.83468396e-10,
         3.83468394e-10, -3.83468394e-10, -3.83468394e-10, -3.83468394e-10,
         3.83468394e-10,  3.83468394e-10,  3.83468401e-10,  3.83468396e-10,
         3.83468401e-10,  3.83468400e-10, -3.83468399e-10,  3.83468394e-10,
         3.83468394e-10, -3.83468393e-10, -3.83468394e-10,  3.83468394e-10,
         3.83468399e-10, -3.83468396e-10,  3.83468397e-10,  3.83468396e-10,
        -3.83468396e-10]),
 'sigma_obs_log__': np.array([-2.00955212]),
 'beta': np.array([[ 0.01117073,  0.02496581, -0.04997757,  0.03332093, -0.04325215,
          0.02869929, -0.04351403,  0.02107482, -0.0323463 ,  0.01525876,
         -0.02853991, -0.01302034, -0.02475167,  0.00063693, -0.01806435,
          0.00247632, -0.01524688,  0.00710171, -0.00819142, -0.01022585,
          0.09467976, -0.06435573,  0.02088479, -0.01316724, -0.02203541,
         -0.00759825,  0.17168579, -0.01900267,  0.01997944,  0.08200404,
          0.03400996]]),
 'sigma_obs': np.array([0.1340487])}

df=future
vectorized=True

if prophet_test.history is None:
    raise Exception('Model has not been fit.')

if df is None:
    df = prophet_test.history.copy()
else:
    if df.shape[0] == 0:
        raise ValueError('Dataframe has no rows.')
    df = prophet_test.setup_dataframe(df.copy())

df['trend'] = prophet_test.predict_trend(df)
seasonal_components = prophet_test.predict_seasonal_components(df)
if prophet_test.uncertainty_samples:
    intervals = prophet_test.predict_uncertainty(df, vectorized)
else:
    intervals = None

# Drop columns except ds, cap, floor, and trend
cols = ['ds', 'trend']
if 'cap' in df:
    cols.append('cap')
if prophet_test.logistic_floor:
    cols.append('floor')
# Add in forecast components
df2 = pd.concat((df[cols], intervals, seasonal_components), axis=1)
df2['yhat'] = (
        df2['trend'] * (1 + df2['multiplicative_terms'])
        + df2['additive_terms']
)

tmp = tmp.sort_values("ds")
tmp.index = tmp.ds
tmp_y = tmp[~np.isnan(tmp["y"])]
y_predict = df2.loc[:,["ds","yhat"]]
y_predict.index = y_predict.ds
tmp_y.drop("ds",axis=1,inplace=True)
y_predict.drop("ds",axis=1,inplace=True)
res = tmp_y.merge(y_predict,how="left",on="ds")
res.y = sc.inverse_transform(res.y.values.reshape(-1,1)).flatten()
res.yhat = sc.inverse_transform(res.yhat.values.reshape(-1,1)).flatten()
valid_res = res[res.index>=pd.to_datetime("2015-06-14")]
print(np.sqrt(np.mean(((valid_res.yhat-valid_res.y)/valid_res.y)**2)))
其结果(RMSPE)为
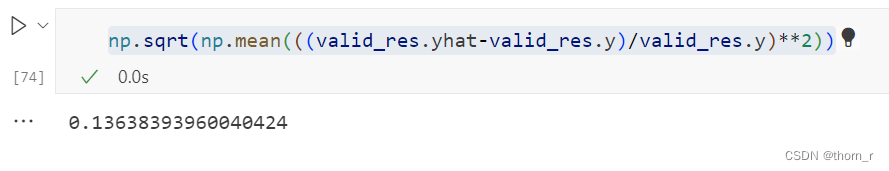
而在prophet原生上效果则好很多:
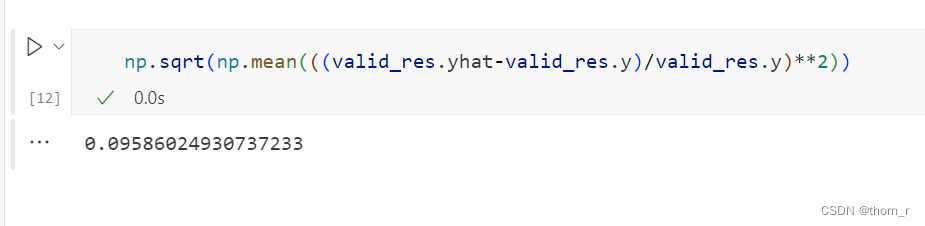
可能是由于Stan与pymc的算法实现有所差异或者是prophet在版本更新时与我现在解读的代码有部分差异。


 2346
2346


 被折叠的 条评论
为什么被折叠?
被折叠的 条评论
为什么被折叠?
 到【灌水乐园】发言


