


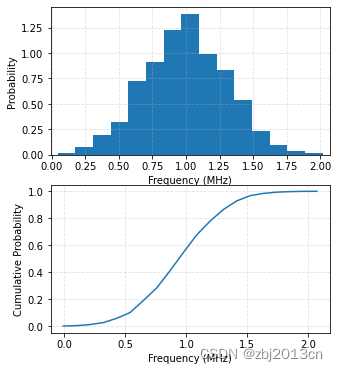
 该篇文章介绍了如何使用Python中的numpy、scipy和matplotlib库来生成正态分布的随机样本,计算频率分布、概率密度函数(PDF)以及累积分布函数(CDF),并通过图表展示结果。
"""
@author: zhang
"""
import numpy as np
from scipy import stats
import matplotlib.pyplot as plt

mean,std=1,0.3
sample_size=2000

# norm distribution
samples=stats.norm.rvs(mean,std,size=sample_size)

res=stats.relfreq(samples,numbins=20)
pdf_value=res.frequency
cdf_value=np.cumsum(res.frequency)

x=res.lowerlimit+np.linspace(0,res.binsize*res.frequency.size,res.frequency.size)

fig,(ax1,ax2)=plt.subplots(2,1,figsize=(5,6))
ax1.set_xlabel('Frequency (MHz)')
ax1.set_ylabel('Probability')
ax1.hist(samples,15,density=True)

ax1.set_xlim([x.min(),x.max()])
ax1.grid(True,linestyle='--',alpha=0.4)
ax2.set_xlabel('Frequency (MHz)')
ax2.set_ylabel('Cumulative Probability')
ax2.plot(x,cdf_value)
ax2.grid(True,linestyle='--',alpha=0.4)

plt.show()
运行后结果如下:


 481
481

 被折叠的 条评论
为什么被折叠?
被折叠的 条评论
为什么被折叠?
 到【灌水乐园】发言


