


matplotlib 画图功能非常强大,目前也只能根据官网 提供的例子简单地画几张图。最近学习了能画动态图的animation模块,作个简单地记录。
在matplotlib作图中,比较常用的是matplotlib.pyplot模块,这个模块有非常多的属性和方法,简要列举下这次用到的方法:
matplotlib.pyplot.subplots(nrows=1, ncols=1, sharex=False, sharey=False, squeeze=True, subplot_kw=None, gridspec_kw=None, **fig_kw)
返回fig和ax对象!
例子1. 动态画出sin函数曲线
import numpy as np
import matplotlib.pyplot as plt
from matplotlib.animation import FuncAnimation

fig, ax = plt.subplots()
xdata, ydata = [], []
ln, = ax.plot([], [], 'r-', animated=False)

def init():
    ax.set_xlim(0, 2*np.pi)
    ax.set_ylim(-1, 1)
    return ln,

def update(frame):
    xdata.append(frame)
    ydata.append(np.sin(frame))
    ln.set_data(xdata, ydata)
    return ln,

ani = FuncAnimation(fig, update, frames=np.linspace(0, 2*np.pi, 128),
                    init_func=init, blit=True)
plt.show()
画这类图的关键是要给出不断更新的函数,这里就是update 函数了。注意, line, = ax.plot([], [], 'r-', animated=False) 中的, 表示创建tuple类型。迭代更新的数据frame 取值从frames 取得。
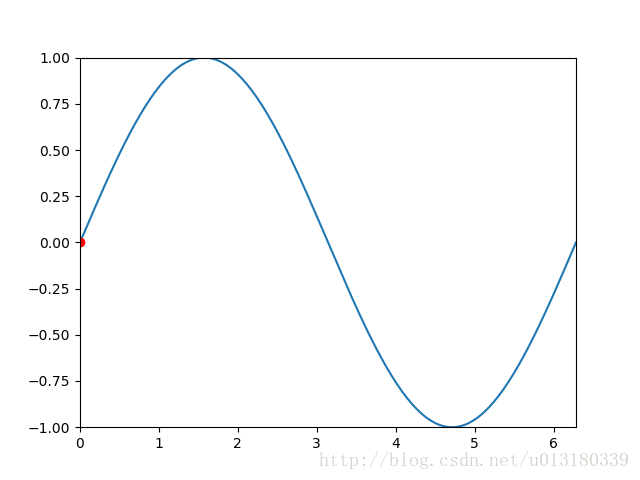
例子2. 动态显示一个动点,它的轨迹是sin函数。
import numpy as np
import matplotlib.pyplot as plt
from matplotlib import animation

"""
animation example 2
author: Kiterun
"""

fig, ax = plt.subplots()
x = np.linspace(0, 2*np.pi, 200)
y = np.sin(x)
l = ax.plot(x, y)
dot, = ax.plot([], [], 'ro')

def init():
    ax.set_xlim(0, 2*np.pi)
    ax.set_ylim(-1, 1)
    return l

def gen_dot():
    for i in np.linspace(0, 2*np.pi, 200):
        newdot = [i, np.sin(i)]
        yield newdot

def update_dot(newd):
    dot.set_data(newd[0], newd[1])
    return dot,

ani = animation.FuncAnimation(fig, update_dot, frames = gen_dot, interval = 100, init_func=init)
ani.save('sin_dot.gif', writer='imagemagick', fps=30)

plt.show()
这里我们把生成的动态图保存为gif图片,前提要预先安装imagemagic。
例子3. 单摆(没阻尼&有阻尼)
无阻尼的单摆力学公式:
 最低0.47元/天 解锁文章


 1万+
1万+

 被折叠的 条评论
为什么被折叠?
被折叠的 条评论
为什么被折叠?
 到【灌水乐园】发言


