


离散型变量分布
import numpy as np
import matplotlib.pyplot as plt
import pandas as pd

# 查看离散型随机变量的分布
arr1 = np.random.randint(1,10,(1000,))
# print(arr1)

df = pd.DataFrame(arr1, )
# (df[0].value_counts().sort_index()/df.shape[0]).plot()  # 下面3行可以用这一行一步到位
data = df[0].value_counts().sort_index()/df.shape[0]
x = data.index
y = data.values
fig, ax = plt.subplots()  # Create a figure containing a single axes.
ax.plot(x, y)  # Plot some data on the axes.
ax.set_xlabel('x')
ax.set_ylabel('y')
plt.show()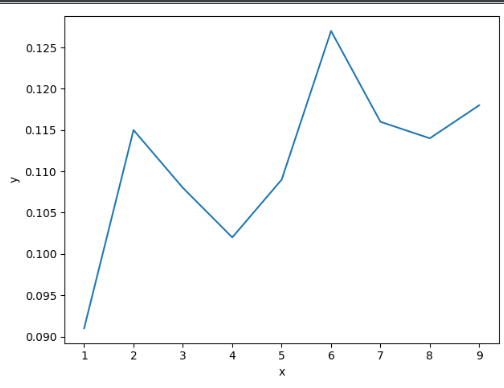
查看连续型随机变量分布
import numpy as np
import matplotlib.pyplot as plt
import pandas as pd


# 查看连续型随机变量的分布,可以绘制直方图
x = np.random.randn(10000)  # 正太分布生成x
fig, ax = plt.subplots()  # Create a figure containing a single axes.
ax.hist(x, bins=100)  # Plot some data on the axes.
ax.set_xlabel('x')  # x是这个取值
ax.set_ylabel('num')  #
plt.show()
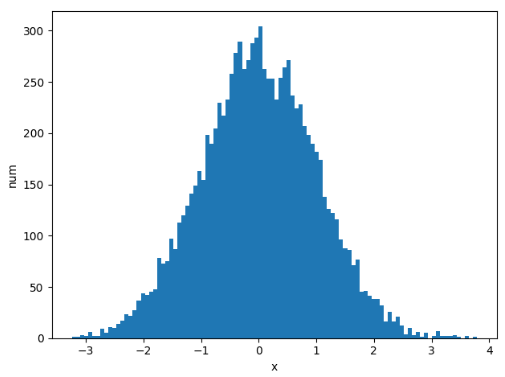
可以看到整体也是呈现正太分布的


 737
737


 被折叠的 条评论
为什么被折叠?
被折叠的 条评论
为什么被折叠?
 到【灌水乐园】发言


