


一般线性模型和线性回归模型
Interpretability is one of the biggest challenges in machine learning. A model has more interpretability than another one if its decisions are easier for a human to comprehend. Some models are so complex and are internally structured in such a way that it’s almost impossible to understand how they reached their final results. These black boxes seem to break the association between raw data and final output, since several processes happen in between.
可解释性是机器学习中最大的挑战之一。 如果一个模型的决策更容易让人理解,那么它的解释性就会比另一个模型高。 有些模型是如此复杂,并且内部结构如此复杂,以至于几乎无法理解它们是如何达到最终结果的。 这些黑匣子似乎打破了原始数据和最终输出之间的关联,因为它们之间发生了多个过程。
But in the universe of machine learning algorithms, some models are more transparent than others. Decision Trees are definitely one of them, and Linear Regression models are another one. Their simplicity and straightforward approach turns them into an ideal tool to approach different problems. Let’s see how.
但是在机器学习算法领域,某些模型比其他模型更透明。 决策树绝对是其中之一,而线性回归模型又是其中之一。 它们的简单和直接的方法使它们成为解决不同问题的理想工具。 让我们看看如何。
You can use Linear Regression models to analyze how salaries in a given place depend on features like experience, level of education, role, city they work in, and so on. Similarly, you can analyze if real estate prices depend on factors such as their areas, numbers of bedrooms, or distances to the city center.
您可以使用线性回归模型来分析给定地点的薪水如何取决于经验,学历,职位,所工作的城市等特征。 同样,您可以分析房地产价格是否取决于面积,卧室数量或距市中心的距离等因素。
In this post, I’ll focus on Linear Regression models that examine the linear relationship between a dependent variable and one (Simple Linear Regression) or more (Multiple Linear Regression) independent variables.
在本文中,我将重点介绍线性回归模型,该模型研究因变量与一个(简单线性回归)或多个(多个线性回归) 自变量之间的线性关系。
简单线性回归(SLR) (Simple Linear Regression (SLR))
Is the simplest form of Linear Regression used when there is a single input variable (predictor) for the output variable (target):
当输出变量(目标)只有一个输入变量(预测变量)时,是使用线性回归的最简单形式:
The input or predictor variable is the variable that helps predict the value of the output variable. It is commonly referred to as X.
输入或预测变量是有助于预测输出变量值的变量。 通常称为X。
The output or target variable is the variable that we want to predict. It is commonly referred to as y.
输出或目标变量是我们要预测的变量。 通常称为y 。

The value of β0, also called the intercept, shows the point where the estimated regression line crosses the y axis, while the value of β1 determines the slope of the estimated regression line. The random error describes the random component of the linear relationship between the dependent and independent variable (the disturbance of the model, the part of y that X is unable to explain). The true regression model is usually never known (since we are not able to capture all the effects that impact the dependent variable), and therefore the value of the random error term corresponding to observed data points remains unknown. However, the regression model can be estimated by calculating the parameters of the model for an observed data set.
β0的值( 也称为截距 )显示估算的回归线与y轴交叉的点,而β1的值确定估算的回归线的斜率 。 随机误差描述了因变量和自变量之间线性关系的随机成分(模型的扰动, X无法解释的y部分)。 真正的回归模型通常是未知的(因为我们无法捕获影响因变量的所有影响),因此与观察到的数据点相对应的随机误差项的值仍然未知。 但是,可以通过为观察到的数据集计算模型的参数来估计回归模型。
The idea behind regression is to estimate the parameters β0 and β1 from a sample. If we are able to determine the optimum values of these two parameters, then we will have the line of best fit that we can use to predict the values of y, given the value of X. In other words, we try to fit a line to observe a relationship between the input and output variables and then further use it to predict the output of unseen inputs.
回归背后的想法是从样本中估计参数β0和β1 。 如果我们能够确定这两个参数的最佳值,则在给定X的值的情况下,我们将具有最佳拟合线,可用于预测y的值。 换句话说,我们尝试拟合一条线以观察输入变量和输出变量之间的关系,然后进一步使用它来预测未见输入的输出。

How do we estimate β0 and β1? We can use a method called Ordinary Least Squares (OLS). The goal behind this is to minimize the distance from the black dots to the red line as close to zero as possible, which is done by minimizing the squared differences between actual and predicted outcomes.
我们如何估计β0 和β1 ? 我们可以使用一种称为普通最小二乘(OLS)的方法 。 其背后的目标是使黑点到红线的距离尽可能地接近零,这是通过最小化实际结果与预测结果之间的平方差来实现的。
The difference between actual and predicted values is called residual (e) and can be negative or positive depending on whether the model overpredicted or underpredicted the outcome. Hence, to calculate the net error, adding all the residuals directly can lead to the cancellations of terms and reduction of the net effect. To avoid this, we take the sum of squares of these error terms, which is called the Residual Sum of Squares (RSS).
实际值与预测值之差称为残差(e) 可以是负值或正值,具体取决于模型是高估还是低估了结果。 因此,为了计算净误差,直接将所有残差相加会导致项的抵消和净效应的减小。 为了避免这种情况,我们采用这些误差项的平方和,称为残差平方和(RSS)。
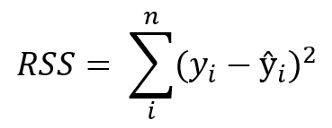
The Ordinary Least Squares (OLS) method minimizes the residual sum of squares, and its objective is to fit a regression line that would minimize the distance (measured in quadratic values) from the observed values to the predicted ones (the regression line).
普通最小二乘法(OLS)方法使残差平方和最小化 ,其目的是拟合一条回归线,以使从观测值到预测值的距离(以二次值度量)最小化(回归线)。
多元线性回归(MLR) (Multiple Linear Regression (MLR))
Is the form of Linear Regression used when there are two or more predictors or input variables. Similar to the SLR model described before, it includes additional predictors:
是形式 有两个或多个预测变量或输入变量时使用的线性回归系数。 与之前描述的SLR模型类似,它包含其他预测变量:

Notice that the equation is just an extension of the Simple Linear Regression one, in which each input/ predictor has its corresponding slope coefficient (β). The first β term (β0) is the intercept constant and is the value of y in absence of all predictors (i.e when all X terms are 0).
注意,该方程只是简单线性回归方程的扩展,其中每个输入/预测变量都有其对应的斜率系数(β) 。 第一个β 项(β0)是截距常数,是在没有所有预测变量的情况下(即,当所有X项均为0时)的y值。
As the number of features grows, the complexity of our model increases and it becomes more difficult to visualize, or even comprehend, our data. Because there are more parameters in these models compared to SLR ones, more care is needed when working with them. Adding more terms will inherently improve the fit to the data, but the new terms may not have any real significance. This is dangerous because it can lead to a model that fits that data but doesn’t actually mean anything useful.
随着功能部件数量的增加,我们模型的复杂性也随之增加,并且更加难以可视化甚至理解我们的数据。 由于与SLR相比,这些模型中的参数更多,因此在使用它们时需要格外小心。 添加更多术语会从本质上改善数据的拟合度,但是新术语可能没有任何实际意义。 这很危险,因为它可能会导致模型适合该数据,但实际上并不意味着有用。
一个例子 (An example)
The advertising dataset consists of the sales of a product in 200 different markets, along with advertising budgets for three different media: TV, radio, and newspaper. We’ll use the dataset to predict the amount of sales (dependent variable), based on the TV, radio and newspaper advertising budgets (independent var
 最低0.47元/天 解锁文章


 1601
1601

 被折叠的 条评论
为什么被折叠?
被折叠的 条评论
为什么被折叠?
 到【灌水乐园】发言


