


nfl定理
NFL 2020 season is coming soon. For preview this season, I’m going to visualize some rushing data using 2019 dataset.
NFL 2020赛季即将到来。 为了预览本季,我将使用2019年数据集可视化一些紧急数据。
Please see also my article about quaterback data visualization.
另请参阅我有关四分之四数据可视化的文章。
1.概述 (1. Overview)
In this article, I’m going to use this dataset as below. Thanks to Mr. Ron Yurko.
在本文中,我将使用以下数据集。 感谢Ron Yurko先生。
There is play-by-play dataset of pre-season, regular season and play-off. I’m going to use only regular season and visualize some rusher stats. How many run yards did they have in total and on average? How is their performance when in the specific situation such as quarter, down and score behind.
有季前,常规赛和附加赛的逐项比赛数据集。 我将仅使用常规季节并可视化一些冲刺统计数据。 他们总共平均有多少码? 他们在特定情况下的表现如何,例如四分之一,下降,得分落后。
OK, Let’s get down to implementation.
好的,让我们开始实施。
2.预处理 (2. Preprocessing)
import pandas as pd
pd.set_option(“max_columns”, 400)
pbp = pd.read_csv(“play_by_play_data/regular_season/reg_pbp_2019.csv”)
roster = pd.read_csv(“roster_data/regular_season/reg_roster_2019.csv”)
See the dataframe info of pbp dataset.
查看pbp数据集的数据框信息。
pbp.info()<class ‘pandas.core.frame.DataFrame’> RangeIndex: 45546 entries, 0 to 45545 Columns: 256 entries, play_id to defensive_extra_point_conv dtypes: float64(130), int64(21), object(105) memory usage: 89.0+ MB
<class'pandas.core.frame.DataFrame'> RangeIndex:45546个条目,0至45545列:256个条目,play_id到defensive_extra_point_conv dtypes:float64(130),int64(21),object(105)内存使用量:89.0+ MB
It’s too large to visualize rushing data, so narrow down the columns. Please note “yards_gained” doesn’t include lateral rush.
它太大了,无法可视化紧急数据,因此请缩小列范围。 请注意,“ yards_gained”不包括横向奔波。
pbp_custom = pbp[
  [
    “game_id”
    ,”game_half”
    ,”qtr”
    ,”time”
    ,”posteam”
    ,”yardline_100"
    ,”down”
    ,”ydstogo”
    ,”yards_gained”
    ,”play_type”
    ,”two_point_attempt”
    ,”first_down_rush”
    ,”rush_attempt”
    ,”rush_touchdown”
    ,”rusher_player_id”
    ,”rusher_player_name”
    ,”score_differential”
  ]
].sort_values(
  [
    “game_id”
    ,”game_half”
    ,”qtr”
    ,”time”
  ]
  ,ascending=[
    True
    ,True
    ,True
    ,False
  ]
)
Aggregate season total rushing by player and also by player, quarter and down.
总计赛季总冲刺人数,也包括球员,季度和下降。
#Aggregate by player
rush_stats_season = pbp_custom[
  (pbp_custom.two_point_attempt == 0)
  & (pbp_custom.rush_attempt == 1)
].groupby(
  [
    “rusher_player_id”
    ,”rusher_player_name”
  ]
  ,as_index=False
).agg(
  {
    “rush_attempt”: “sum”
    ,”yards_gained”: “sum”
    ,”first_down_rush”: “sum”
    ,”rush_touchdown”: “sum”
  }
)# Only who over 1000 yards in season
rush_stats_season = rush_stats_season[
  rush_stats_season.yards_gained >= 1000
].sort_values([“yards_gained”], ascending=False)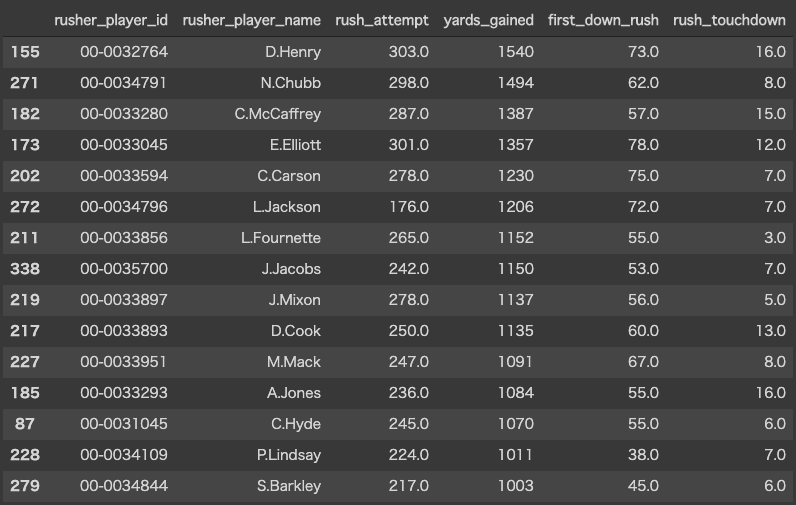
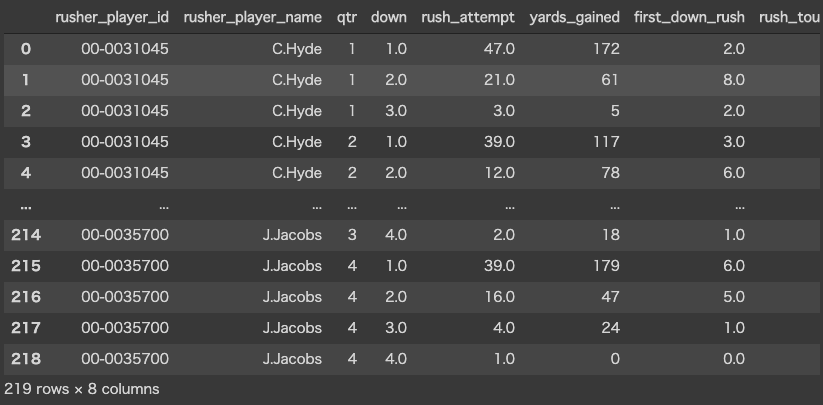
#Aggregate by player, quarter and down
rush_stats_details = pbp_custom[
  (pbp_custom.two_point_attempt == 0)
  & (pbp_custom.rush_attempt == 1)
  & (pbp_custom.rusher_player_id.isin(
    rush_stats_season.rusher_player_id
  )) # Only who over 1000 yards in season
].groupby(
  [
    “rusher_player_id”
    ,”rusher_player_name”
    ,”qtr”
    ,”down”
  ]
  ,as_index=False
).agg(
  {
    “rush_attempt”: “sum”
    ,”yards_gained”: “sum”
    ,”first_down_rush”: “sum”
    ,”rush_touchdown”: “sum”
  }
)
3.可视化 (3. Visualization)
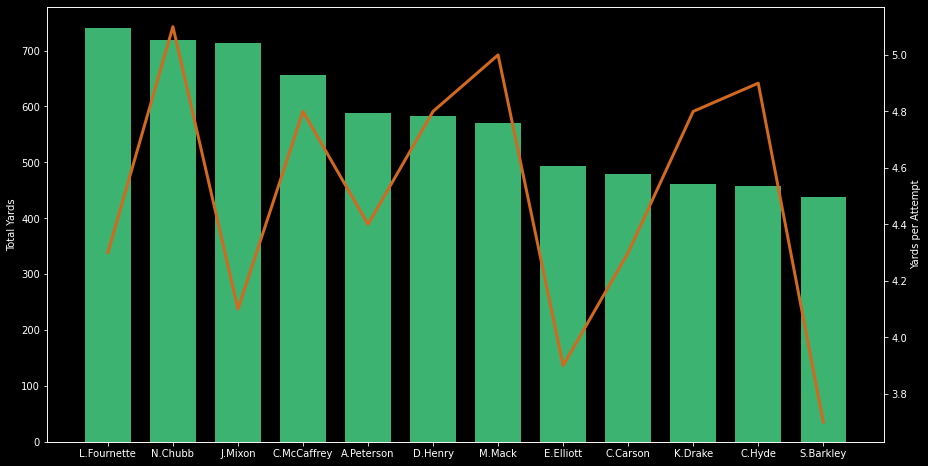
Firstly, I visualize total yards gain ranking using histogram. Not only total yards, also visualize average yards per rushing attempt.
首先,我使用直方图可视化总码增益排名。 不仅总码,还可视化每次冲刺的平均码数。
%matplotlib inline
import matplotlib.pyplot as pltwith plt.rc_context(
  {
    "axes.edgecolor":"white"
    ,"xtick.color":"white"
    , "ytick.color":"white"
    , "figure.facecolor":"white"
  }
):
  fig = plt.figure(figsize=(15, 8), facecolor=”black”)
  ax_hist = fig.add_subplot(111, facecolor=”black”)
  ax_line = ax_hist.twinx() #Share X-axis#Plot histogram
ax_hist.bar(
  rush_stats_season.rusher_player_name
  ,rush_stats_season.yards_gained
  ,color = “mediumseagreen”
  ,width=0.7
)
ax_hist.set_ylim(800, 1600)
ax_hist.set_ylabel(“Total Yards”, color=”white”)#Plot line in the same axes with histogram
ax_line.plot(
  rush_stats_season.rusher_player_name
  ,rush_stats_season.yards_per_attempt
  ,”chocolate”
  ,linewidth=3
)
ax_line.set_ylim(4, 7)
ax_line.set_ylabel(“Yards per Attempt”, color=”white”)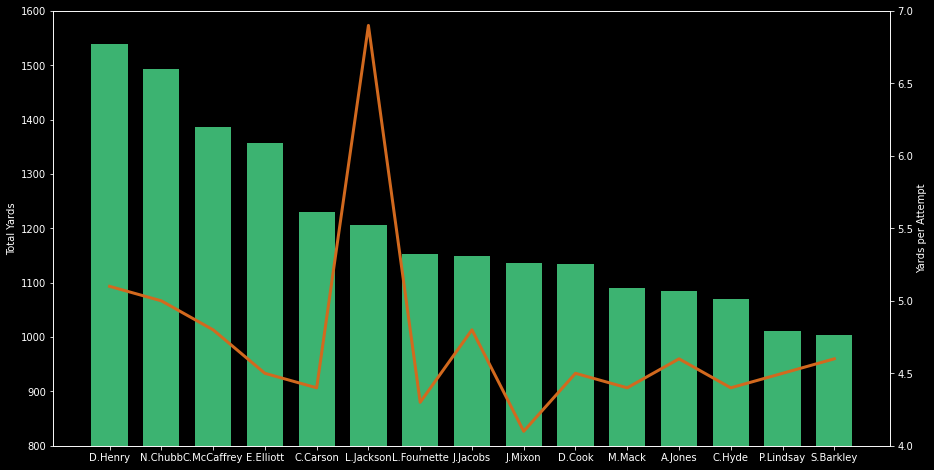
Top 5 players are all Running Back but can you see that Lamar Jackson has outstanding average yards? Almost all of the players in the ranking are 4–5 yards but he is nearly 7 (of course 4–5 is also outstanding). This means almost 1st down when he runs.
前5名选手都在跑回头,但是您能看到Lamar Jackson拥有出色的平均码吗? 排名中几乎所有球员都是4-5码,但他几乎是7码(当然4-5也很出色)。 这意味着他跑步时几乎倒下了1。
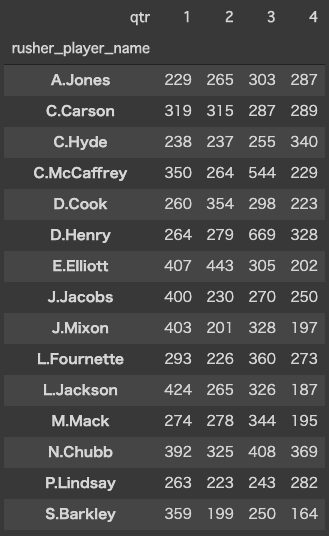
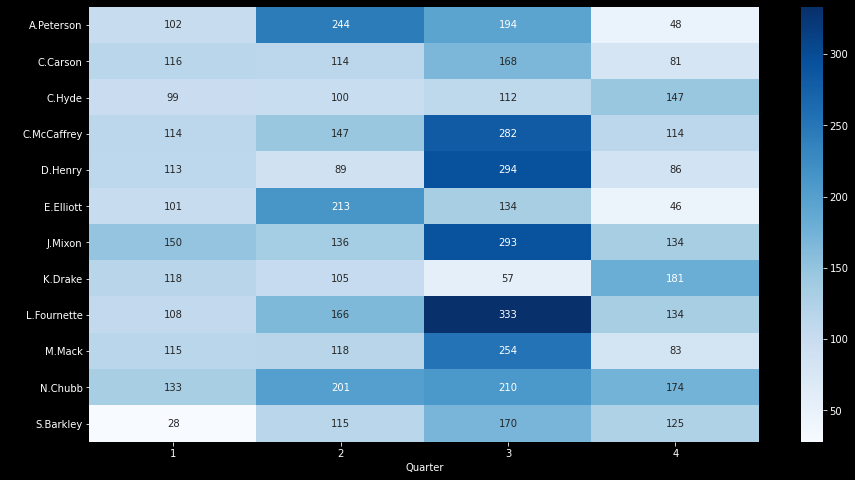
Next, from a different perspective, how about each quarter? I use heatmap in seaborn library.
接下来,从另一个角度来看,每个季度如何? 我在seaborn库中使用heatmap。
Firstly, we need to create pivot table which has player name as index, quarter as column and gained yards as value. Gained yards is aggregated total.
首先,我们需要创建数据透视表,该数据透视表的玩家名称为索引,四分之一为列,获得的码数为价值。 获得的码是总计。
rush_stats_qtr_pivot = pd.pivot_table(
  data=rush_stats_details[rush_stats_details.qtr <= 4]
  ,values=”yards_gained”
  ,columns=”qtr”
  ,index=”rusher_player_name”
  ,aggfunc=”sum”
)
I visualize this data as heatmap. Set pivot table as data source and can display actual value using “annot” parameter.
我将此数据可视化为热图。 将数据透视表设置为数据源,并可以使用“ annot”参数显示实际值。
import numpy as np
import seaborn as snswith plt.rc_context(
  {
    "axes.edgecolor":"white"
    ,"xtick.color":"white"
    , "ytick.color":"white"
    , "figure.facecolor":"white"
  }
):
  plt.figure(figsize=(15, 8), facecolor=”black”)
  sns.heatmap(
    rush_stats_qtr_pivot
    ,annot=True #Display values
    ,fmt=”g”
    ,cmap=”Blues”
  )plt.xlabel(“Quarter”, color=”white”)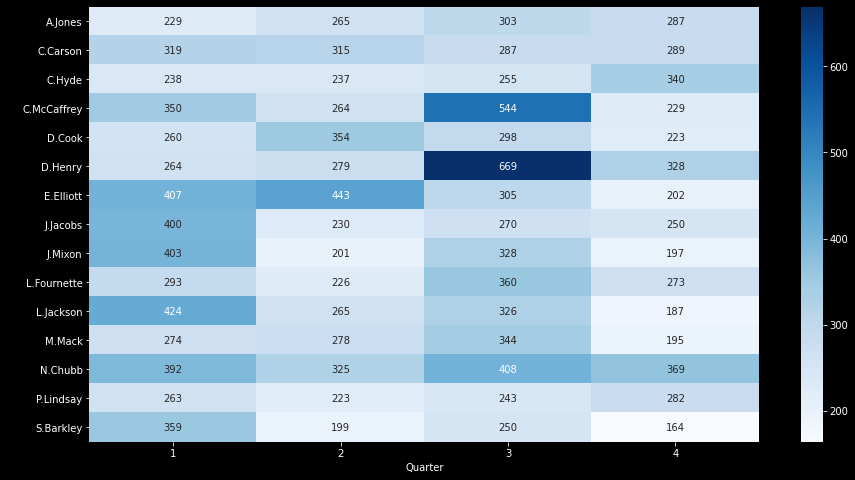
Derrick Henry and Christian McCaffrey looks strong in 3rd quarter. Henry, Carlos Hyde and Nick Chubb has more yards in 4th. Meanwhile, Ezeliel Elliott is strong in 1st half.
德里克·亨利(Derrick Henry)和克里斯蒂安·麦卡弗里(Christian McCaffrey)在第三季度表现强劲。 亨利,卡洛斯·海德和尼克·丘布在第4位还有更多码。 同时,Ezeliel Elliott上半场表现强劲。
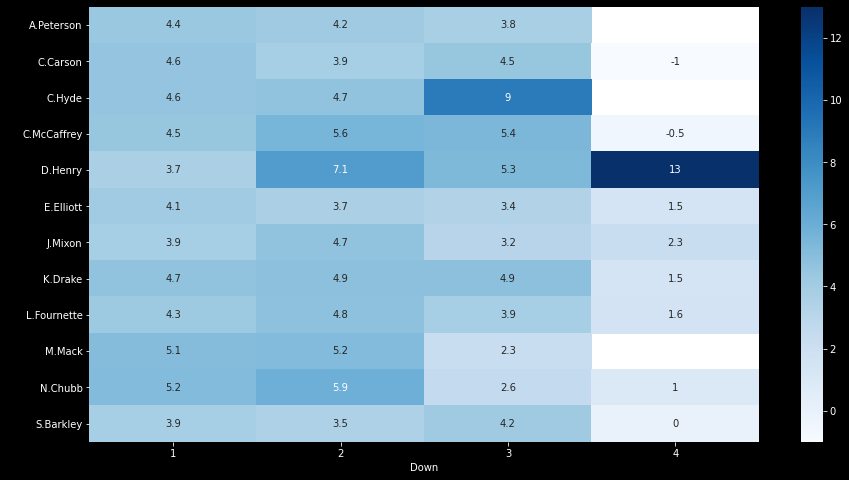
In addition, I want to see also each down. At this time, I’m going to use average yards not gross yards.
另外,我也想看看每个下来。 此时,我将使用平均码而不是总码。
#Aggregate by player and down
rush_stats_down = rush_stats_details.groupby(
  [
    “rusher_player_name”
    ,”down”
  ]
  ,as_index=False
).agg(
  {
    “rush_attempt”: “sum”
    ,”yards_gained”: “sum”
  }
)rush_stats_down[“yards_per_attempt”] = round(rush_stats_down.yards_gained / rush_stats_down.rush_attempt, 1)rush_stats_down = rush_stats_down.astype({“down”: int})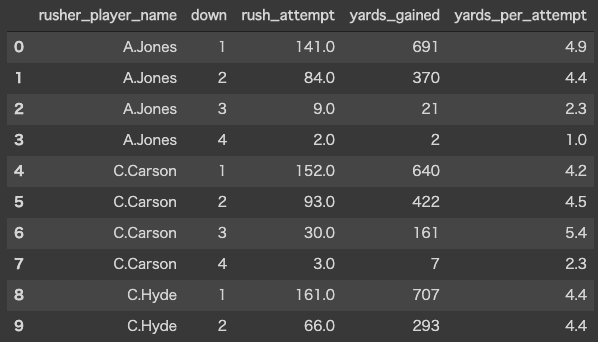
I create pivot table again.
我再次创建数据透视表。
rush_stats_down_pivot = pd.pivot_table(
  data=rush_stats_down
  ,values=”yards_per_attempt”
  ,columns=”down”
  ,index=”rusher_player_name”
  ,aggfunc=”sum”
)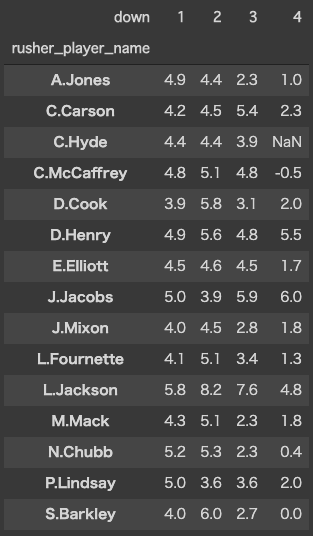
Visualize it.
可视化它。
with plt.rc_context(
  {
    "axes.edgecolor":"white"
    ,"xtick.color":"white"
    , "ytick.color":"white"
    , "figure.facecolor":"white"
  }
):
  plt.figure(figsize=(15, 8), facecolor=”black”)
  sns.heatmap(
    rush_stats_down_pivot
    ,annot=True
    ,fmt=”g”
    ,cmap=”Blues”
  )plt.xlabel(“Down”, color=”white”)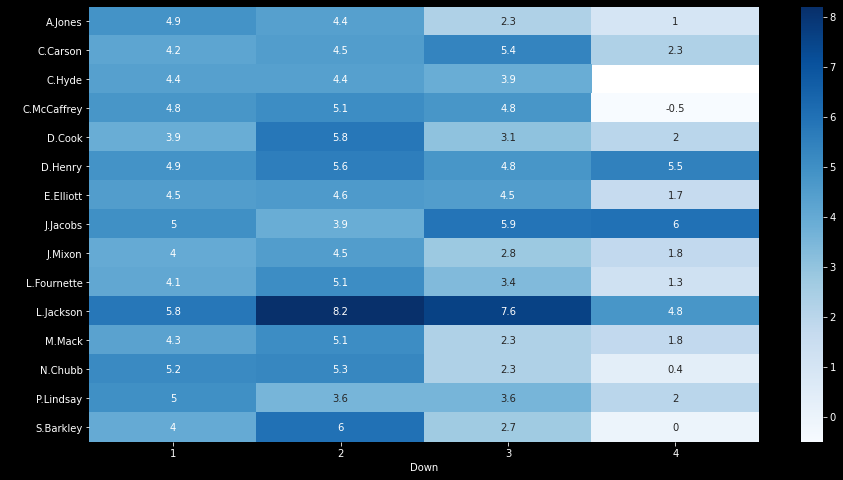
We can see many 5+ boxes in heatmap, but Jackson is outstanding. He always gains over 5 yards 1–3rd down (4th is almost 5), this means if he rushes twice Ravens gets 1st down. Why cannot we say he is the best rusher?
我们可以在热图中看到许多5个以上的方框,但杰克逊非常出色。 他总是在1到3下降时获得5码以上的距离(第4几乎是5),这意味着如果他两次冲进Ravens就会获得1下降。 为什么不能说他是最好的冲刺者?
Henry and Josh Jacobs also gains almost 5 yards every down. Can we say these three rushers are the best in NFL?
亨利(Henry)和乔什(Josh Jacobs)每次下跌都获得近5码的球。 我们可以说这三位选手是NFL最好的选手吗?
In the end, extra visualization, I create same figure using dataset which has rushing play when offense team was score behind.
最后,进行额外的可视化处理,我使用数据集创建了相同的身材,当进攻队落后时,该数据集将发挥作用。
Pay attention to Chabb, Henry, Leonard Fournette and Kenyan Drake when they are in adversity? They never give up.
在逆境中关注沙布,亨利,伦纳德·富内特和肯亚德雷克吗? 他们从不放弃。
Thank you for reading!!
谢谢您的阅读!!
翻译自: https://medium.com/@sh_in/nfl-2020-preview-with-python-rushing-d24b0439a96e
nfl定理


 3293
3293


 被折叠的 条评论
为什么被折叠?
被折叠的 条评论
为什么被折叠?
 到【灌水乐园】发言


