


python eda
介绍 (Introduction)
Exploratory data analysis is one of the best practices used in data science today. While starting a career in Data Science, people generally don’t know the difference between Data analysis and exploratory data analysis. There is not a very big difference between the two, but both have different purposes.
探索性数据分析是当今数据科学中使用的最佳实践之一。 在开始从事数据科学职业时,人们通常不知道数据分析与探索性数据分析之间的区别。 两者之间并没有太大的区别,但是两者的目的不同。
Exploratory Data Analysis(EDA): Exploratory data analysis is a complement to inferential statistics, which tends to be fairly rigid with rules and formulas. At an advanced level, EDA involves looking at and describing the data set from different angles and then summarizing it.
探索性数据分析(EDA):探索性数据分析是对推论统计的补充, 推论统计通常倾向于使用规则和公式进行严格的处理。 在高级方面,EDA涉及从不同角度查看和描述数据集,然后进行汇总。
Data Analysis: Data Analysis is the statistics and probability to figure out trends in the data set. It is used to show historical data by using some analytics tools. It helps in drilling down the information, to transform metrics, facts, and figures into initiatives for improvement.
数据分析:数据分析是统计和概率,以确定数据集中的趋势。 它用于通过使用某些分析工具来显示历史数据。 它有助于挖掘信息,将指标,事实和数据转化为改进计划。
探索性数据分析(EDA) (Exploratory Data Analysis(EDA))
We will explore a Data set and perform the exploratory data analysis. The major topics to be covered are below:
我们将探索一个数据集并进行探索性数据分析。 涉及的主要主题如下:
— Handle Missing value — Removing duplicates — Outlier Treatment — Normalizing and Scaling( Numerical Variables) — Encoding Categorical variables( Dummy Variables) — Bivariate Analysis
—处理缺失值—删除重复项—离群值处理—归一化和缩放(数字变量)—编码分类变量(虚拟变量)—双变量分析
#导入库 (# Importing Libraries)

#加载数据集 (# Loading the data set)
We will be loading the EDA cars excel file using pandas. For this, we will be using read_excel file.
我们将使用熊猫加载EDA汽车excel文件。 为此,我们将使用read_excel文件。
#基础数据探索 (# Basic Data Exploration)
In this step, we will perform the below operations to check what the data set comprises of. We will check the below things:
在此步骤中,我们将执行以下操作以检查数据集所包含的内容。 我们将检查以下内容:
— head of the dataset — the shape of the dataset — info of the dataset — summary of the dataset
—数据集的头部—数据集的形状—数据集的信息—数据集的摘要
- The head function will tell you the top records in the data set. By default, python shows you only the top 5 records. 头函数将告诉您数据集中的最高记录。 默认情况下,python仅显示前5条记录。
- The shape attribute tells us a number of observations and variables we have in the data set. It is used to check the dimension of data. The cars data set has 303 observations and 13 variables in the data set. shape属性告诉我们数据集中的许多观测值和变量。 用于检查数据的维数。 汽车数据集包含303个观测值和13个变量。

3. info() is used to check the Information about the data and the datatypes of each respective attribute.
3. info()用于检查有关数据和每个相应属性的数据类型的信息。

Looking at the data in the head function and in info, we know that the variable Income and travel time are of float data type instead of the object. So we will convert it into the float. Also, there are some invalid values like @@ and ‘* ‘ in the data which we will be treating as missing values.
查看head函数和info中的数据,我们知道变量Income和travel time是float数据类型而不是object。 因此,我们将其转换为浮点数。 此外,数据中还有一些无效值,例如@@和' * ',我们将其视为缺失值。

4. The described method will help to see how data has been spread for numerical values. We can clearly see the minimum value, mean values, different percentile values, and maximum values.
4.所描述的方法将有助于了解如何分散数值数据。 我们可以清楚地看到最小值,平均值,不同的百分位数值和最大值。

处理缺失值 (Handling missing value)

We can see that we have various missing values in the respective columns. There are various ways of treating your missing values in the data set. And which technique to use when is actually dependent on the type of data you are dealing with.
我们可以看到在相应的列中有各种缺失值。 有多种方法可以处理数据集中的缺失值。 而何时使用哪种技术实际上取决于您要处理的数据类型。
- Drop the missing values: In this case, we drop the missing values from those variables. In case there are very few missing values you can drop those values. 删除缺失值:在这种情况下,我们从那些变量中删除缺失值。 如果缺少的值很少,则可以删除这些值。
- Impute with mean value: For the numerical column, you can replace the missing values with mean values. Before replacing with mean value, it is advisable to check that the variable shouldn’t have extreme values .i.e. outliers. 用平均值估算:对于数字列,您可以用平均值替换缺失值。 在用平均值代替之前,建议检查变量不应该具有极高的值,即离群值。
- Impute with median value: For the numerical column, you can also replace the missing values with median values. In case you have extreme values such as outliers it is advisable to use the median approach. 用中值估算:对于数字列,您也可以用中值替换缺失值。 如果您有极端值(如离群值),建议使用中位数法。
- Impute with mode value: For the categorical column, you can replace the missing values with mode values i.e the frequent ones. 带模式值的插补:对于类别列,您可以将缺失值替换为模式值,即频繁的值。
In this exercise, we will replace the numerical columns with median values and for categorical columns, we will drop the missing values.
在本练习中,我们将数字列替换为中值,对于分类列,我们将删除缺失值。


处理重复记录 (Handling Duplicate records)
Since we have 14 duplicate records in the data, we will remove this from the data set so that we get only distinct records. Post removing the duplicate, we will check whether the duplicates have been removed from the data set or not.
由于数据中有14条重复记录,因此我们将从数据集中删除该记录,以便仅获得不同的记录。 删除重复项后,我们将检查重复项是否已从数据集中删除。


处理异常值 (Handling Outlier)
Outliers, being the most extreme observations, may include the sample maximum or sample minimum, or both, depending on whether they are extremely high or low. However, the sample maximum and minimum are not always outliers because they may not be unusually far from other observations.
作为最极端观察值的异常值可能包括样本最大值或样本最小值,或两者都包括,这取决于它们是极高还是极低。 但是,样本的最大值和最小值并不总是离群值,因为它们可能与其他观测值相距不远。
We Generally identify outliers with the help of boxplot, so here box plot shows some of the data points outside the range of the data.
通常,我们借助boxplot识别异常值,因此这里的box plot显示了数据范围之外的一些数据点。

Looking at the box plot, it seems that the variables INCOME, have outlier present in the variables. These outliers value needs to be teated and there are several ways of treating them:
从箱形图中可以看出,变量INCOME似乎存在异常值。 这些异常值需要加以了解,并且有几种处理方法:
- Drop the outlier value 降低离群值
- Replace the outlier value using the IQR 使用IQR替换离群值

#Boxplot After removing outlier
#Boxplot移除异常值后

双变量分析 (Bivariate Analysis)
When we talk about bivariate analysis, it means analyzing 2 variables. since we know there are Numerical and categorical variables, there is a way of analyzing these variables as shown below:
当我们谈论双变量分析时,它意味着分析2个变量。 由于我们知道存在数值变量和类别变量,因此有一种分析这些变量的方法,如下所示:
Numerical vs. Numerical1. Scatterplot2. Line plot3. Heatmap for correlation4. Joint plot
数值与数值1。 散点图2。 线图3。 相关的热图4。 联合地块
Categorical vs. Numerical1. Bar chart2. Voilin plot3. Categorical box plot4.Swarm plot
分类与数值1。 条形图2。 Voilin图3。 分类箱图4.群体图
Two Categorcal Variables1. Bar chart2. Grouped bar chart3. Point plot
两个分类变量1。 条形图2。 分组条形图3。 点图
If we need to find the correlation
如果我们需要找到相关性

规范化和缩放 (Normalizing and Scaling)
Often the variables of the data set are of different scales i.e. one variable is in millions and others in only 100. For e.g. in our data set Income is having values in thousands and age in just two digits. Since the data in these variables are of different scales, it is tough to compare these variables.
通常,数据集的变量具有不同的标度,即一个变量以百万计,其他变量仅以100为例。例如,在我们的数据集中,收入的千位数和年龄数值只有两位数。 由于这些变量中的数据具有不同的比例,因此很难比较这些变量。
Feature scaling (also known as data normalization) is the method used to standardize the range of features of data. Since the range of values of data may vary widely, it becomes a necessary step in data preprocessing while using machine learning algorithms.
特征缩放(也称为数据规范化)是用于标准化数据特征范围的方法。 由于数据值的范围可能相差很大,因此它成为使用机器学习算法时数据预处理的必要步骤。
In this method, we convert variables with different scales of measurements into a single scale. StandardScaler normalizes the data using the formula (x-mean)/standard deviation. We will be doing this only for the numerical variables.
在这种方法中,我们将具有不同度量标准的变量转换为单个尺度。 StandardScaler使用公式(x-均值)/标准差对数据进行归一化。 我们将仅对数字变量执行此操作。


编码 (ENCODING)
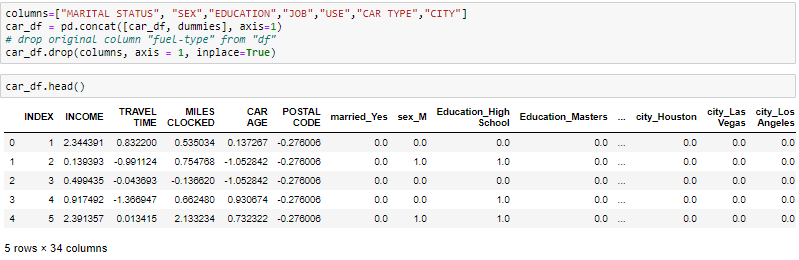
One-Hot-Encoding is used to create dummy variables to replace the categories in a categorical variable into features of each category and represent it using 1 or 0 based on the presence or absence of the categorical value in the record.
一键编码用于创建伪变量,以将分类变量中的类别替换为每个类别的特征,并根据记录中是否存在分类值使用1或0表示它。
This is required to do since the machine learning algorithms only work on the numerical data. That is why there is a need to convert the categorical column into a numerical one.
由于机器学习算法仅对数值数据起作用,因此需要这样做。 这就是为什么需要将分类列转换为数字列的原因。
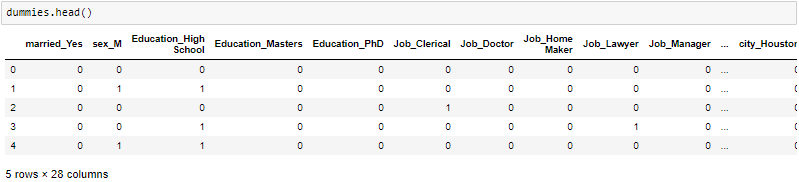
get_dummies is the method that creates a dummy variable for each categorical variable.
get_dummies是为每个分类变量创建一个虚拟变量的方法。

I hope you must be clear with the concept of Exploratory Data Analysis(EDA), do try this on the different dataset and let me know on comments. Thank you for reading.
我希望您必须对探索性数据分析(EDA)的概念有所了解,并在不同的数据集上进行尝试,并在评论中告知我。 感谢您的阅读。
翻译自: https://medium.com/swlh/exploratory-data-analysis-eda-from-scratch-in-python-8c12c2673aa7
python eda


 340
340


 被折叠的 条评论
为什么被折叠?
被折叠的 条评论
为什么被折叠?
 到【灌水乐园】发言


