


倍频程频谱
GNU Octave is a free, scientific programming language. It offers a rich mathematical apparatus, concise syntax, and has built-in visualization tools [1]. The whole package is really handy. It has a graphical user interface (GUI) and command-line interface versions. It feels like a standard Integrated Development Environment (IDE) for Java or Python.
GNU Octave是一种免费的科学编程语言。 它提供了丰富的数学工具,简洁的语法,并具有内置的可视化工具[1]。 整个包装真的很方便。 它具有图形用户界面(GUI)和命令行界面版本。 感觉就像是Java或Python的标准集成开发环境(IDE)。
Octave can be used for solving various mathematical problems, building simulations, or working on data science projects. If you’re familiar with Matlab [2], or you’re looking for a quick way of prototyping your science-related ideas, you should definitely try Octave. Let’s go through practical examples that will help you to start your journey with this tool.
Octave可用于解决各种数学问题,构建模拟或从事数据科学项目。 如果您熟悉Matlab [2],或者正在寻找一种原型方法来制作与科学相关的想法的原型,那么您绝对应该尝试使用Octave。 让我们来看一些实用的示例,这些示例将帮助您开始使用此工具。
安装 (Installation)
On Debian operating systems (e.g. Ubuntu) you can install Octave by using the built-in package manager:
在Debian操作系统(例如Ubuntu)上,您可以使用内置的软件包管理器来安装Octave:
If you’ll be prompted about missing packages check here [3] for the command with full a list of needed packages for your version of the operating system. For ubuntu 20.4 it looks like this:
如果系统提示您缺少软件包,请在此处[3]中查找命令,其中包含完整的操作系统版本所需软件包的列表。 对于ubuntu 20.4,它看起来像这样:
If you’re using Windows simply download the installer executable file or a zip file and unpack it. Current version 5.2, and instructions for macOS and BSD systems, are available here [4].
如果您使用的是Windows,只需下载安装程序可执行文件或zip文件并解压缩即可。 当前版本5.2以及macOS和BSD系统的说明可在此处获得[4]。
GUI指南 (GUI guide)
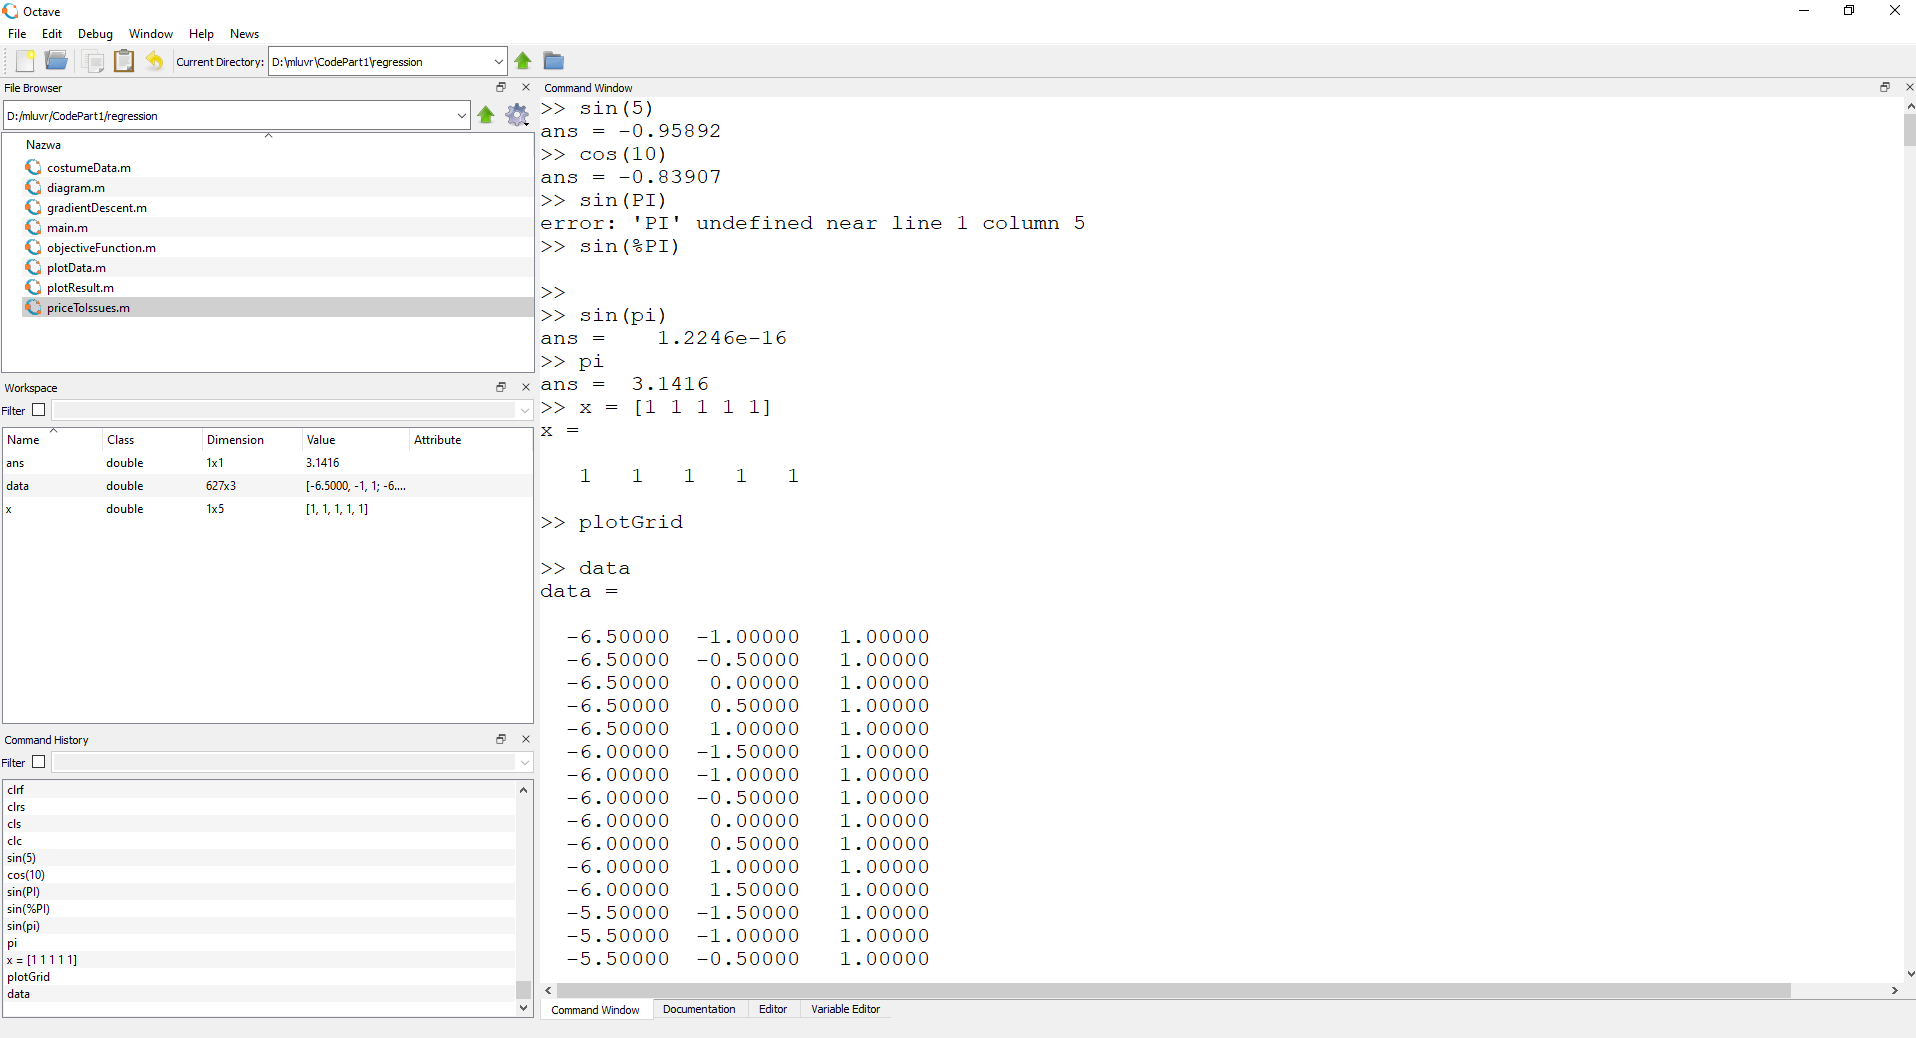
Octave GUI consists of 4 main parts. The most important one is the panel that covers the biggest area on the right. By default, it is a Command Window. Here you can type any Octave commands in interactive mode and they are immediately executed, showing the result.
Octave GUI包含4个主要部分。 最重要的是覆盖右侧最大区域的面板。 默认情况下,它是一个命令窗口。 您可以在此处以交互方式键入任何Octave命令,它们会立即执行,并显示结果。
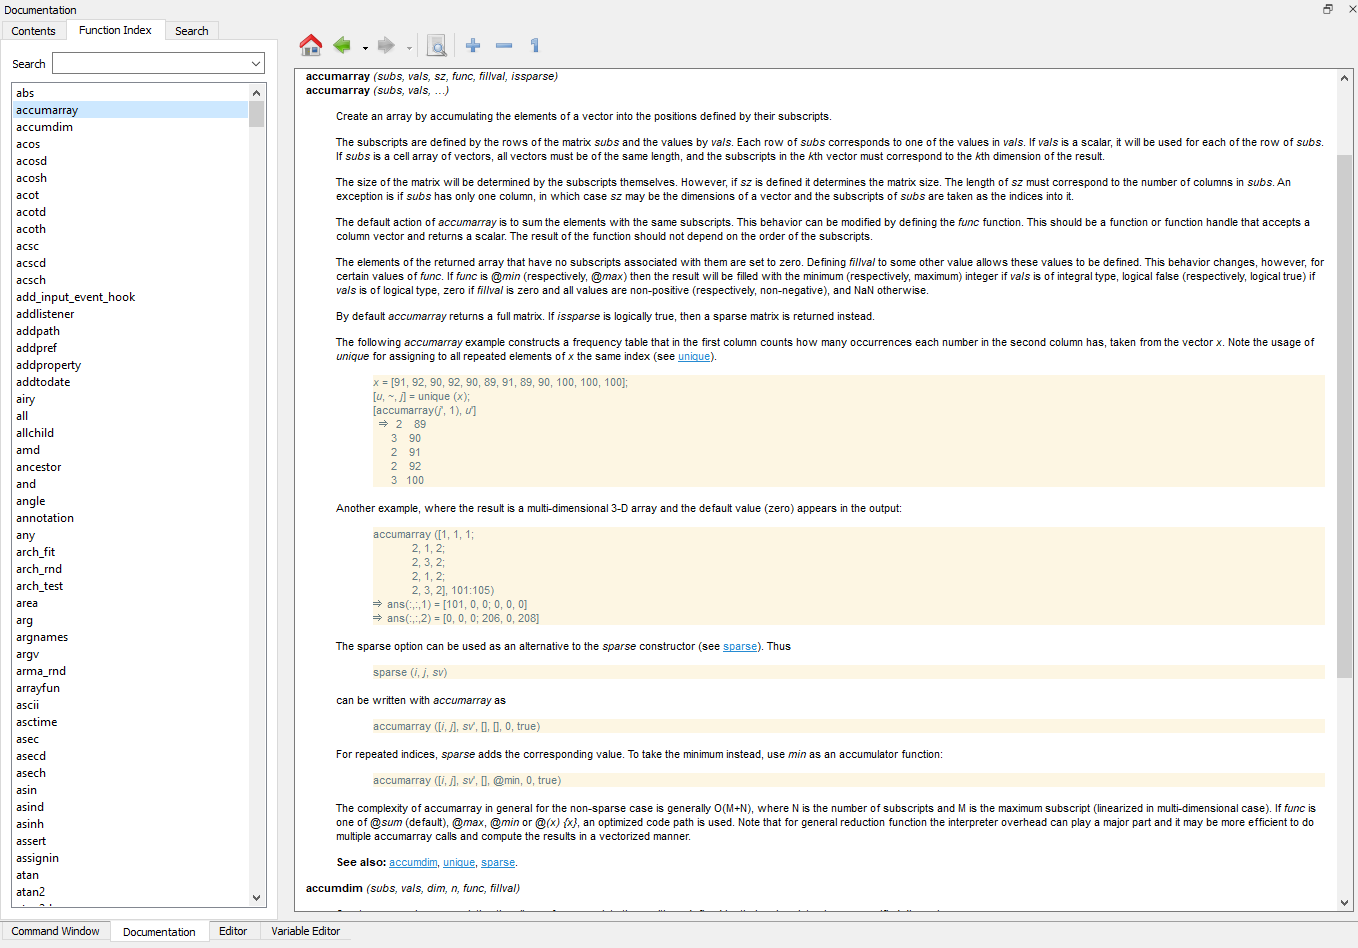
At the bottom of the Command Window, you can find another 3 tabs. The second one is Documentation. It’s a very handy, offline version of the whole Octave docs. It is divided by themed sections where you can read about topics like Data Types or Statements. It also contains a separate functions index with examples:
在命令窗口的底部,您可以找到另外3个选项卡。 第二个是文档。 这是整个Octave文档的非常方便的离线版本。 它按主题部分划分,您可以在其中阅读有关数据类型或语句之类的主题。 它还包含带有示例的单独的函数索引:
The last two tabs under the main area on the right are Editor and Variable Editor. The editor tab is simply a text editor where you type your Octave code. It has a syntax completion feature, but in general, is quite minimalistic. In Variable Editor, you can choose a variable and change its values. It is useful while dealing with multidimensional variables, so you don’t get confused when you need to edit them by hand. From my experience, it’s quite rarely used functionality.
右侧主区域下的最后两个选项卡是编辑器和变量编辑器。 编辑器选项卡只是一个文本编辑器,您可以在其中键入八度编码。 它具有语法完成功能,但总的来说,它非常简单。 在变量编辑器中,您可以选择一个变量并更改其值。 它在处理多维变量时很有用,因此当您需要手动编辑它们时不会感到困惑。 根据我的经验,它很少使用。
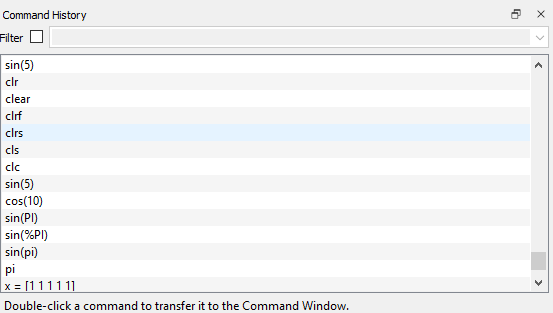
On the left part of the main window, there are 3 panels. At the top, there is a File Browser where you choose your project directory and can manipulate its files. Below you’ll find a Workspace that contains all active variables as well as their short descriptions (type, dimension, values, attributes). The last panel contains Commands History. It allows you to search for and filter the commands you used in the past:
在主窗口的左侧,有3个面板。 在顶部,有一个文件浏览器,您可以在其中选择项目目录并可以操纵其文件。 下面你会发现它包含了所有活跃的变量以及它们的简短描述(类型,尺寸,值,属性)工作区。 最后一个面板包含“命令历史记录” 。 它允许您搜索和过滤您过去使用的命令:
处理数据 (Working with data)
Data and variables are core parts of any computer program. Take a look at how to define different types of variables and load files in Octave.
数据和变量是任何计算机程序的核心部分。 看一下如何在Octave中定义不同类型的变量和加载文件。
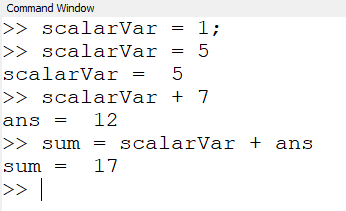
In the screenshot, you can see that defining variables is pretty intuitive. You need to provide a variable name, use assign operator “=” and type a value you want to put under the variable. You can use scalar values like integer numbers, floating-point numbers, text (defined in quotes like “I’m a sample text”). If you just put a value without a name, Octave creates ans variable and keeps there the last value you typed directly in the command window. You can use ans as any other variable.
在屏幕截图中,您可以看到定义变量非常直观。 您需要提供一个变量名,使用赋值运算符“ = ”,然后输入要放入变量下的值。 您可以使用标量值,例如整数,浮点数,文本(用引号定义,例如“我是示例文本”)。 如果只输入一个没有名称的值,Octave会创建一个ans变量,并将您直接在命令窗口中键入的最后一个值保留在此处。 您可以将ans用作任何其他变量。
If you looked at the screenshot carefully, you noticed a trick. When you end your line with a semicolon “;” the command doesn’t print any output. However, commands without a semicolon at the end print the result to the console.
如果仔细查看屏幕截图,您会发现一个窍门。 当您以分号结尾时,“ ; ”命令不会显示任何输出。 但是,最后没有分号的命令会将结果打印到控制台。
定义向量 (Defining vectors)
A vector is a variable that consists of multiple values. You can think of it as of array of elements. To define a vector in Octave you need to provide a vector name and its values separated by space. All statement should be enclosed with square brackets:
向量是由多个值组成的变量。 您可以将其视为元素数组。 要在Octave中定义向量,您需要提供向量名称及其值,并用空格分隔。 所有声明均应使用方括号括起来:
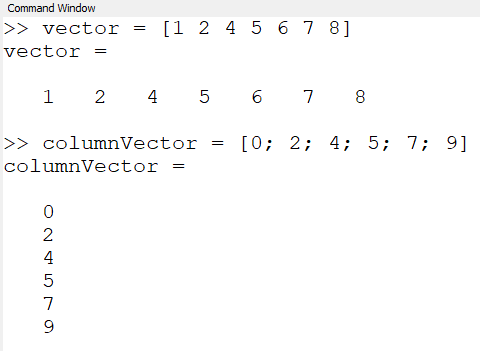
To define a column vector you should separate vector values using a semicolon.
要定义列向量,应使用分号分隔向量值。
定义矩阵 (Defining matrices)
Matrix definitions are as straightforward as vector ones. The main rules are:
矩阵定义和向量定义一样简单。 主要规则是:
- Separate matrix row values with spaces. 用空格分隔矩阵行值。
- Separate matrix columns with semicolons. 用分号分隔矩阵列。
Take a look at the picture:
看一下图片:

定义变量时有用的功能 (Functions useful while defining variables)
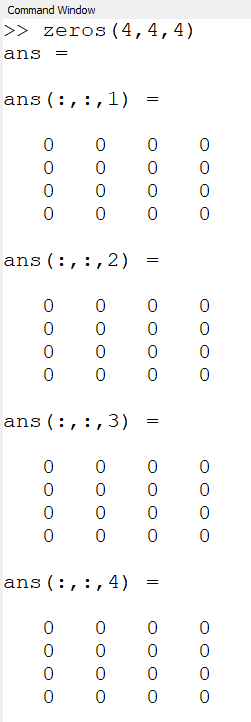
If you want to generate a variable consisting of zeros or ones there are two convenient functions you can use. zeros(m,n,k,..) generates variable full of zeros and m,n,k are integers defining the sizes of dimensions. By analogy you can use ones(m,n,k,…) to get a variable filled with ones:
如果要生成由零或一组成的变量,则可以使用两个方便的函数。 zeros(m,n,k,..)生成充满零的变量,而m,n,k是定义尺寸大小的整数。 以此类推,您可以使用ones(m,n,k,...)来获取一个由1填充的变量:
Another useful way of generating values is generating vectors using given discrete steps. Let’s assume you need a vector that goes from zero to 10 with a step equal to 0.5. In Octave you can define it like this:
生成值的另一种有用方法是使用给定的离散步骤生成矢量。 假设您需要一个从零到10且步长等于0.5的向量。 在Octave中,您可以这样定义它:
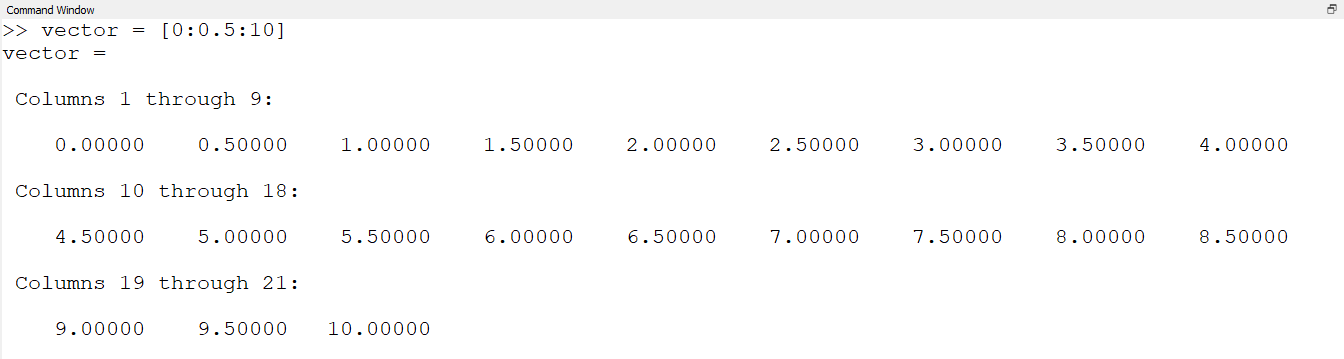
All you need to do is to start with the initial value, step value, and the last value of the vector. These three values should be separated with a colon. In our example vector has 21 elements.
您需要做的就是从向量的初始值,步长值和最后一个值开始。 这三个值应该用冒号分隔。 在我们的示例中,vector有21个元素。
访问元素 (Accessing elements)
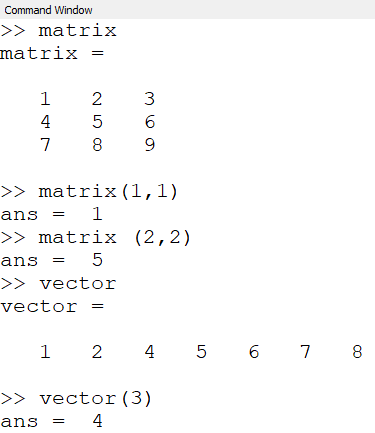
One of the most important things to remember while accessing variables is that Octave starts indexing from 1, not from 0 as most of us are used to. To get the particular element you need to specify its indices inside parenthesis:
访问变量时要记住的最重要的事情之一是Octave从1开始索引,而不是像我们大多数人一样从0开始索引。 要获取特定元素,您需要在括号内指定其索引:
加载数据中 (Loading data)
The easiest way to load the data is to use load(filename.m) function. It expects to have a file with comma-delimited values and columns. Take a look at the example:
加载数据的最简单方法是使用load(filename.m)函数。 它期望有一个带有逗号分隔值和列的文件。 看一下示例:
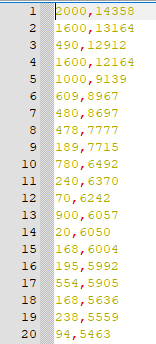
Having such a file, let’s call it myData.m, you simply choose a variable to assign the data and call load function like this:
有了这样的文件,我们将其称为myData.m ,您只需选择一个变量来分配数据并调用如下的load函数:
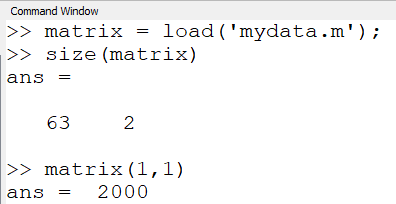
In the picture, you can see that we loaded a matrix variable which has 63 rows, 2 values each. To check the variable size the size(variable) function is used. After loading we check the first element of the first row which is equal to 2000.
在图片中,您可以看到我们加载了一个矩阵变量,该变量具有63行,每行2个值。 要检查变量大小,使用了size(variable)函数。 加载后,我们检查第一行的第一个元素是否等于2000。
Octave also supports more advanced loading functionalities like binary files or defining the delimiter inside the file. To find out more check the load function description in the documentation.
Octave还支持更高级的加载功能,例如二进制文件或在文件内部定义定界符。 要了解更多信息,请查阅文档中的加载功能说明。
基本线性代数运算 (Basic linear algebra operations)
The most powerful part of Octave is a built-in mathematical apparatus. The straightforward and handy syntax makes it even better.
Octave最强大的部分是内置的数学设备。 简单易用的语法使其变得更好。
矩阵加减法 (Adding and subtracting matrices)
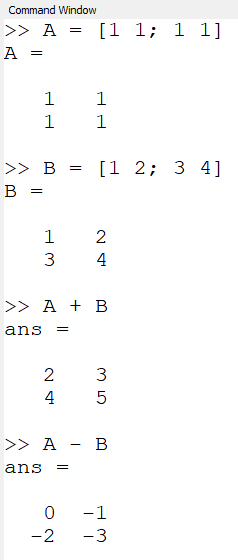
To add or subtract matrices you need to use “+” or “-” minus operator. When you add two matrices of the same sizes the operation will be done using values from corresponding cells (e.g. value from the first row and first column from matrix A plus value from the first row and first column from matrix B).
要添加或减去矩阵,您需要使用“ +”或“-”减运算符。 当您添加两个相同大小的矩阵时,将使用来自相应单元格的值(例如,矩阵A的第一行和第一列的值加上矩阵B的第一行和第一列的值)进行运算。
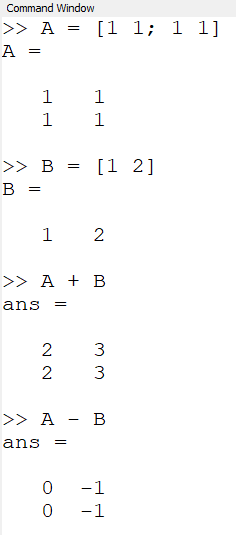
However, you need to be careful. It is also possible to add or subtract a vector. To make it clear let’s look at a couple of different examples:
但是,您需要小心。 也可以添加或减去向量。 为了清楚起见,让我们看几个不同的例子:
矩阵乘法 (Matrix multiplication)
Let’s recall the prerequisite needed to multiply matrices.
让我们回想一下乘法矩阵所需的先决条件。

To multiply matrix A of size m x n by matrix B, the number of rows in matrix B must be equal to the number of columns in matrix A. Assuming that matrix B has size n x k, the result of the multiplication is the matrix C of size m x k. To multiply matrices use the “*” operator.
由矩阵B大小为m×n的矩阵乘法A,在矩阵B的行数必须等于在矩阵A中的列数。 假设矩阵B的大小为nxk,相乘的结果为矩阵C的大小为mx k。 要相乘矩阵,请使用“ *”运算符。
Let’s take a look at the example:
让我们看一个例子:
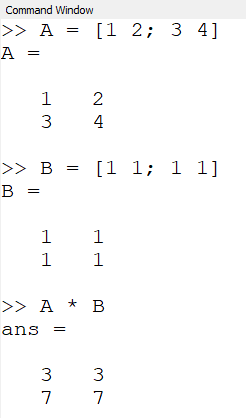
Why we get such a result? Check how each matrix cell is calculated according to matrix multiplication rules:
为什么我们得到这样的结果? 检查如何根据矩阵乘法规则计算每个矩阵像元:

We can apply the same rule to vectors, as they are a special case of matrices (size of 1 x n, or n x 1 in case of column vectors). We’ll get a single value if we multiple vectors of the following sizes:
我们可以对向量应用相同的规则,因为它们是矩阵的特殊情况(大小为1 xn ,对于列向量为nx 1)。 如果我们使用以下大小的多个向量,则会得到一个值:

To visualize this case let’s define vector A and a column vector B and multiply them:
为了使这种情况可视化,让我们定义向量A和列向量B并将它们相乘:
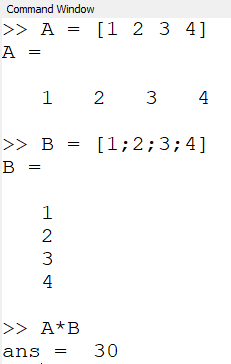
Both vectors consist of 1, 2, 3, 4. Multiplying them is equal to multiplying first elements from A and B and adding the result of multiplication of their second elements and so on until we reach all of the elements. It means we get:
两个向量都由1、2、3、4组成。将它们相乘等于将A和B中的第一个元素相乘,然后将其第二个元素相乘的结果相加,依此类推,直到我们到达所有元素。 这意味着我们得到:

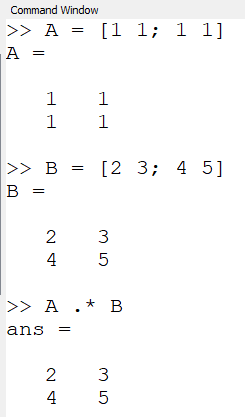
标量矩阵乘法 (Scalar matrix multiplication)
Sometimes you need to multiply corresponding elements of matrices. Of course, it’s not the matrix multiplication according to linear algebra definition, so you can’t use the “*” operator. Instead, Octave has an additional dot “.” operator that goes before the multiplication operator. Let’s see what happens when you use it:
有时您需要乘以矩阵的相应元素。 当然,这不是根据线性代数定义的矩阵乘法,因此您不能使用“ *”运算符。 而是,八度有一个额外的点“。” 乘法运算符之前的运算符。 让我们看看使用它时会发生什么:
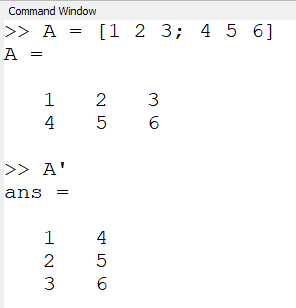
矩阵转置 (Matrix transposition)
To transpose a matrix, it means that we change the rows to the columns and the columns to the rows. As a result, the size of the matrix changes according to the following formula:
要转置矩阵,这意味着我们将行更改为列,将列更改为行。 结果,矩阵的大小根据以下公式变化:

In Octave you can transpose a matrix by using the “ ‘ “ operator:
在八度,你可以使用“'“运营商矩阵转置的:
求解线性方程组 (Solving a linear equations system)
Finally, let’s solve a simple linear equations system:
最后,让我们解决一个简单的线性方程组:

Such a system can be represented by two matrices that map coefficients before variables. The first one represents the left side of the system:
这样的系统可以由在系数之前映射系数的两个矩阵表示。 第一个代表系统的左侧:
![Matrix A [1 2, 2 -2].](https://img-blog.csdnimg.cn/img_convert/6252ffaeea54ea7c0369c910d887b8ee.png)
And the right side looks like this:
右侧看起来像这样:
![Matrix b = [8;1].](https://img-blog.csdnimg.cn/img_convert/0f062a5225853773afa0bf2e4deb62a1.png)
The whole system is represented using the following formula where matrix x consists of variables x and y:
整个系统使用以下公式表示,其中矩阵x由变量x和y组成:

To solve it we could invert matrix A and multiply it by matrix b. In Octave, it is equivalent to using left side division operator “\” [5]. As a result x = A \ b:
为了解决这个问题,我们可以将矩阵A求逆,然后乘以矩阵b。 在Octave中,等效于使用左侧的除法运算符“ \” [5]。 结果x = A \ b:
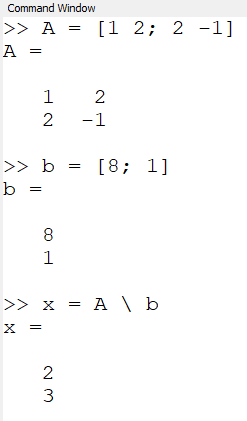
Finally, we got that variable x equals to 2 and variable y equals to 3. That’s the correct answer, great!
最后,我们得到变量x等于2,变量y等于3。这是正确的答案,太好了!
可视化工具 (Visualization tools)
We know that image is worth thousands of words and it can help to understand the problem we try to solve. Fortunately plotting is also a built-in functionality of Octave.
我们知道图像价值数千个单词,可以帮助您理解我们要解决的问题。 幸运的是,绘图也是Octave的内置功能。
绘图点 (Plotting points)
To draw a 2D data point you can use plot function. It takes x and y coordinates of your points as arguments and additional style-related parameters.
要绘制2D数据点,可以使用绘图功能。 它以点的x和y坐标作为参数以及其他与样式相关的参数。
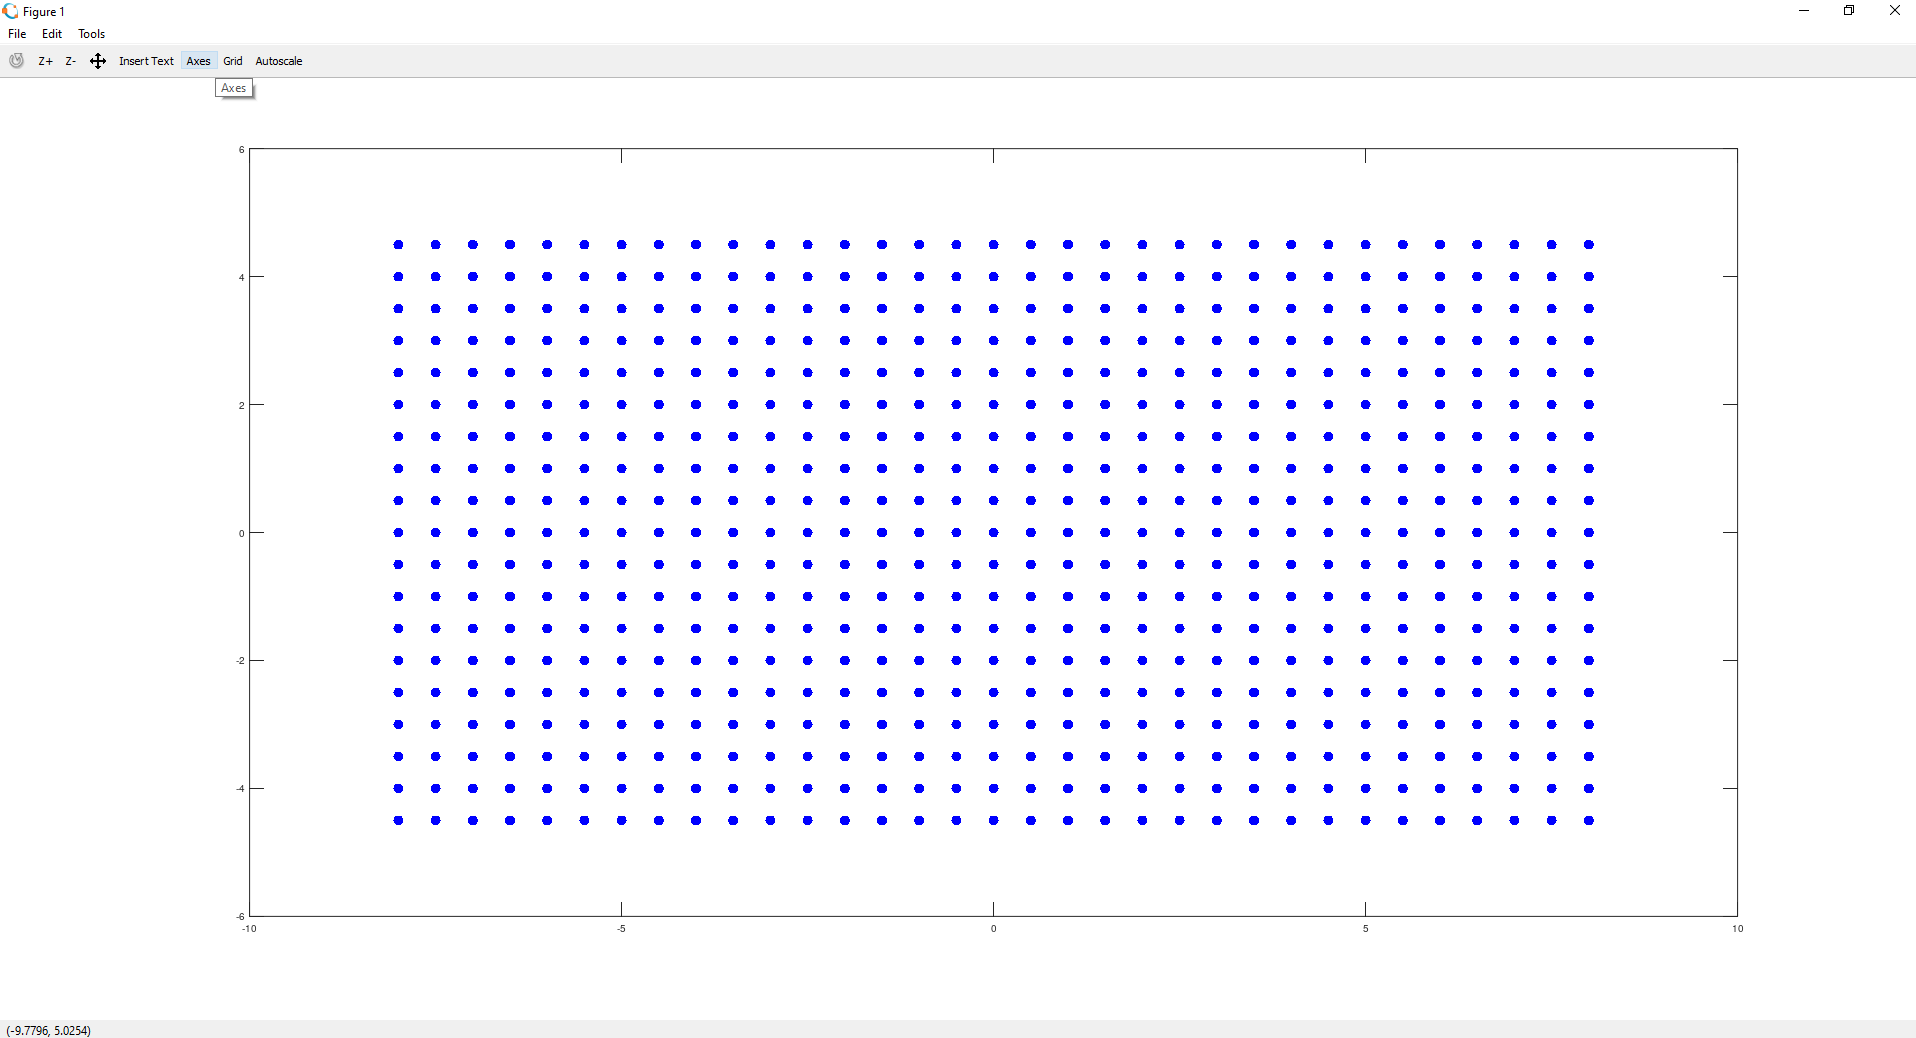
Let’s assume you have a file in which every line contains a point. The code below loads the file into data variable, extracts the x and y coordinates of each point (using the “:” operator), and plot blue points (“b.”) points of size 30 (“markersize” parameter):
假设您有一个文件,其中每一行都包含一个点。 下面的代码将文件加载到数据变量中,提取每个点的x和y坐标(使用“ : ”运算符),并绘制大小为30(“ markersize”参数)的蓝色点(“ b。 ”):
# data.m contains points coordinates:
# 1, 2
# 3, 4


data = load('data.m');


# extract all x (data(:,1)) and y (data(:,2)) coordinates using ":" operator.
x = data(:,1);
y = data(:,2);


plot(x, y, 'b.', 'markersize', 30);
As a result, we get a grid of points:
结果,我们得到了一个点网格:
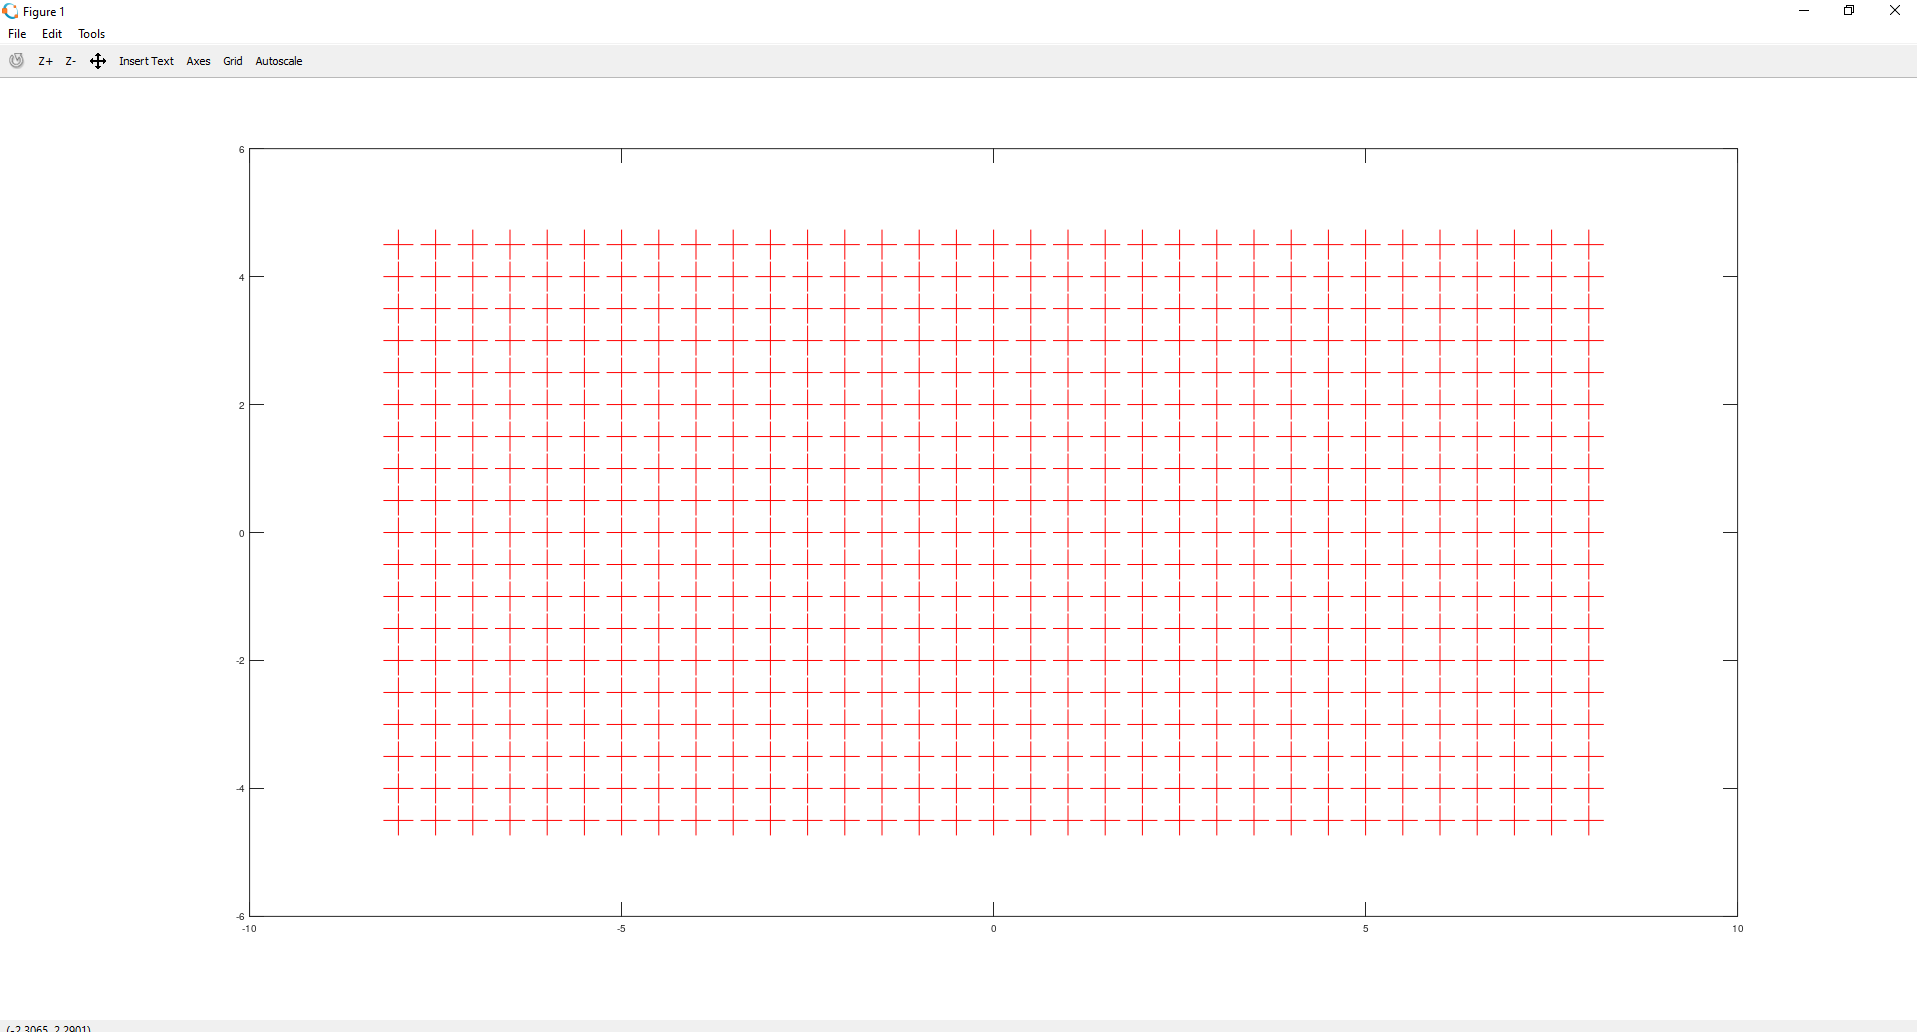
To change colors and style you can try different letters, e.g. g for green, r for red, and for points style characters like “+” or “*”. For example “plot(x, y, ‘r+’, ‘markersize’, 30);” looks like this:
要更改颜色和样式,可以尝试使用不同的字母,例如g表示绿色, r表示红色,以及点样式字符(如“ + ”或“ * ”)。 例如“ plot(x,y,'r +','markersize',30); ”看起来像这样:
绘图功能 (Plotting functions)
You can use the same plot method to draw a function graph. First of all, you need to prepare your vector of discrete coordinates and then a vector of function values for each of the coordinates. What’s important these vectors should have equal sizes.
您可以使用相同的绘图方法来绘制功能图。 首先,您需要准备离散坐标的向量,然后为每个坐标准备函数值的向量。 重要的是,这些向量应具有相等的大小。
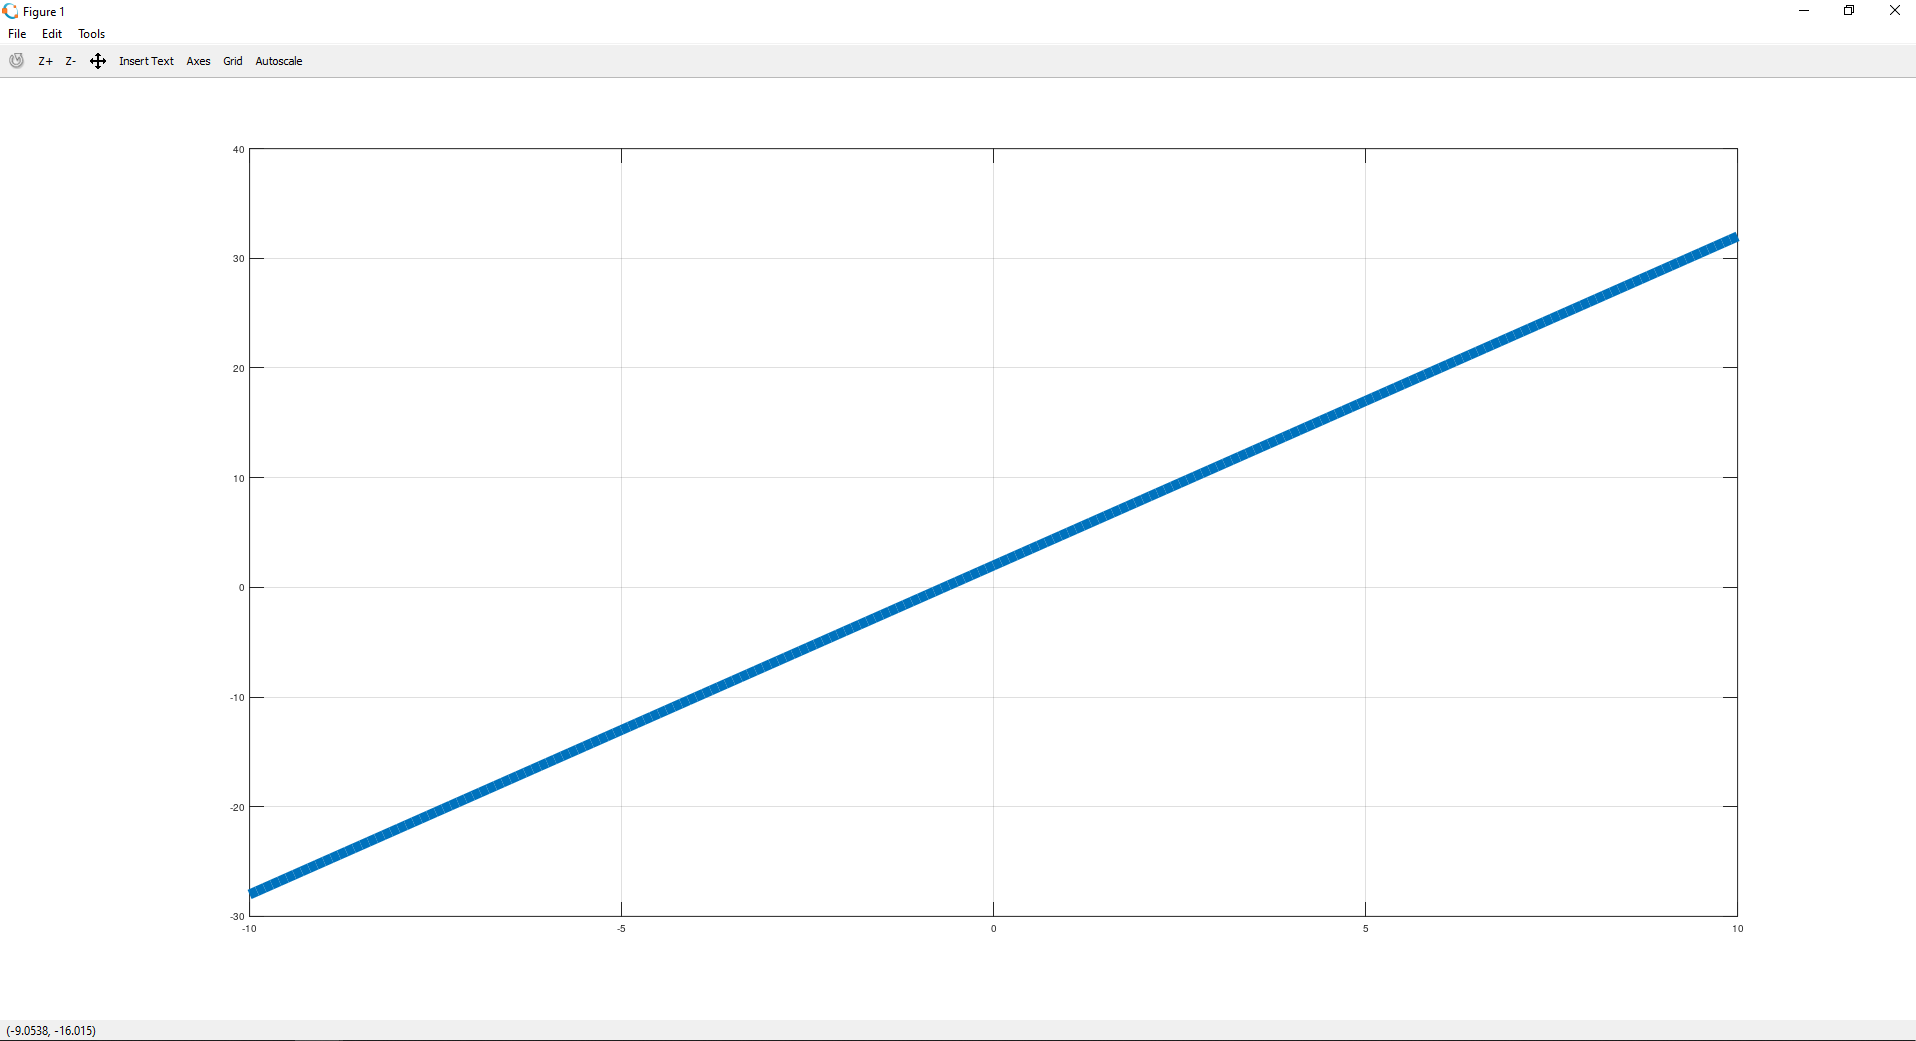
As an example let’s draw a plot of the following function:
作为示例,让我们绘制以下函数的图:

Take a look at the code snippet:
看一下代码片段:
x = [-10: 0.1: 10];
y = 3*x + 2;


plot(x,y,'linewidth' 10);
In the first line, vector x starts from -10 and is filled until values reach 10 (with the step equal to 0.1). So it contains -10, -9.9, -9,8 … 10. Then vector y contains values of the function for each x coordinate. Finally, we plot our function and set its line width to 10:
在第一行中,向量x从-10开始并被填充,直到值达到10(步长等于0.1)。 因此它包含-10,-9.9,-9,8…10。然后,向量y包含每个x坐标的函数值。 最后,我们绘制函数并将其线宽设置为10:
更多功能 (More fancy functions)
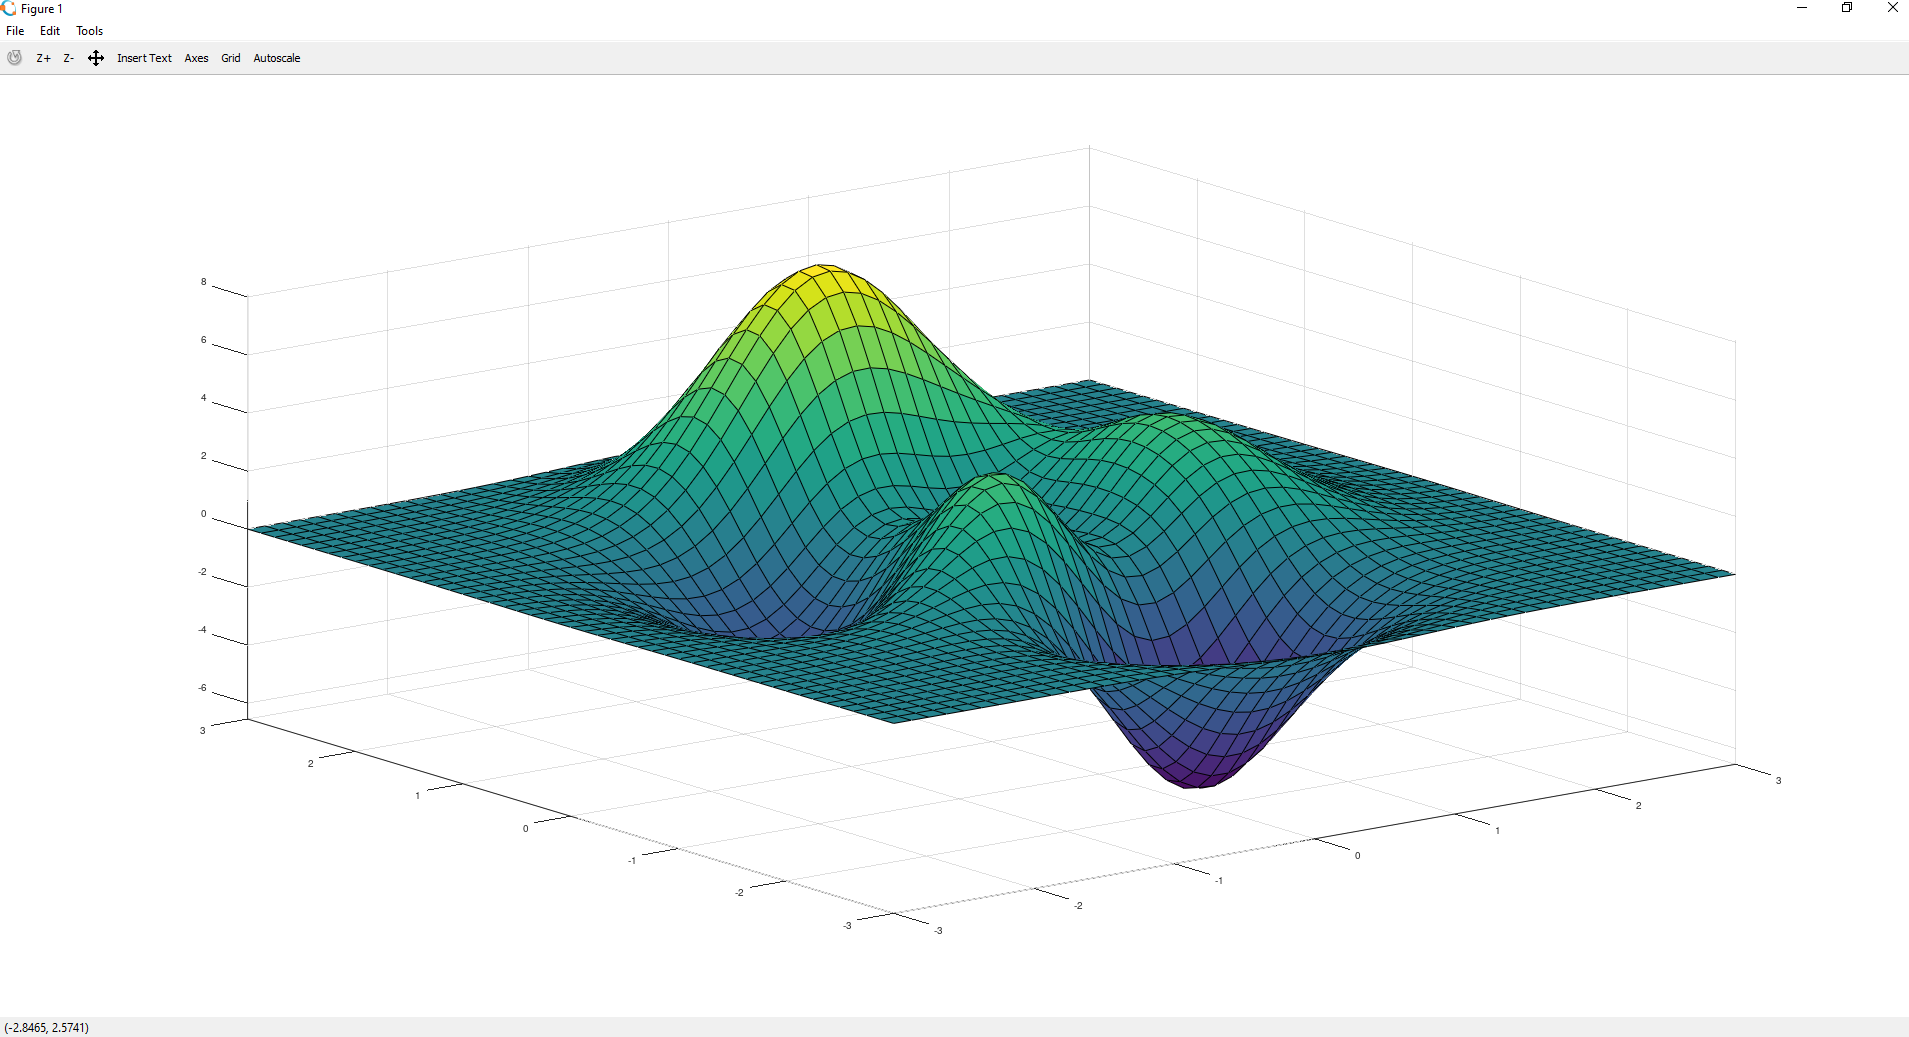
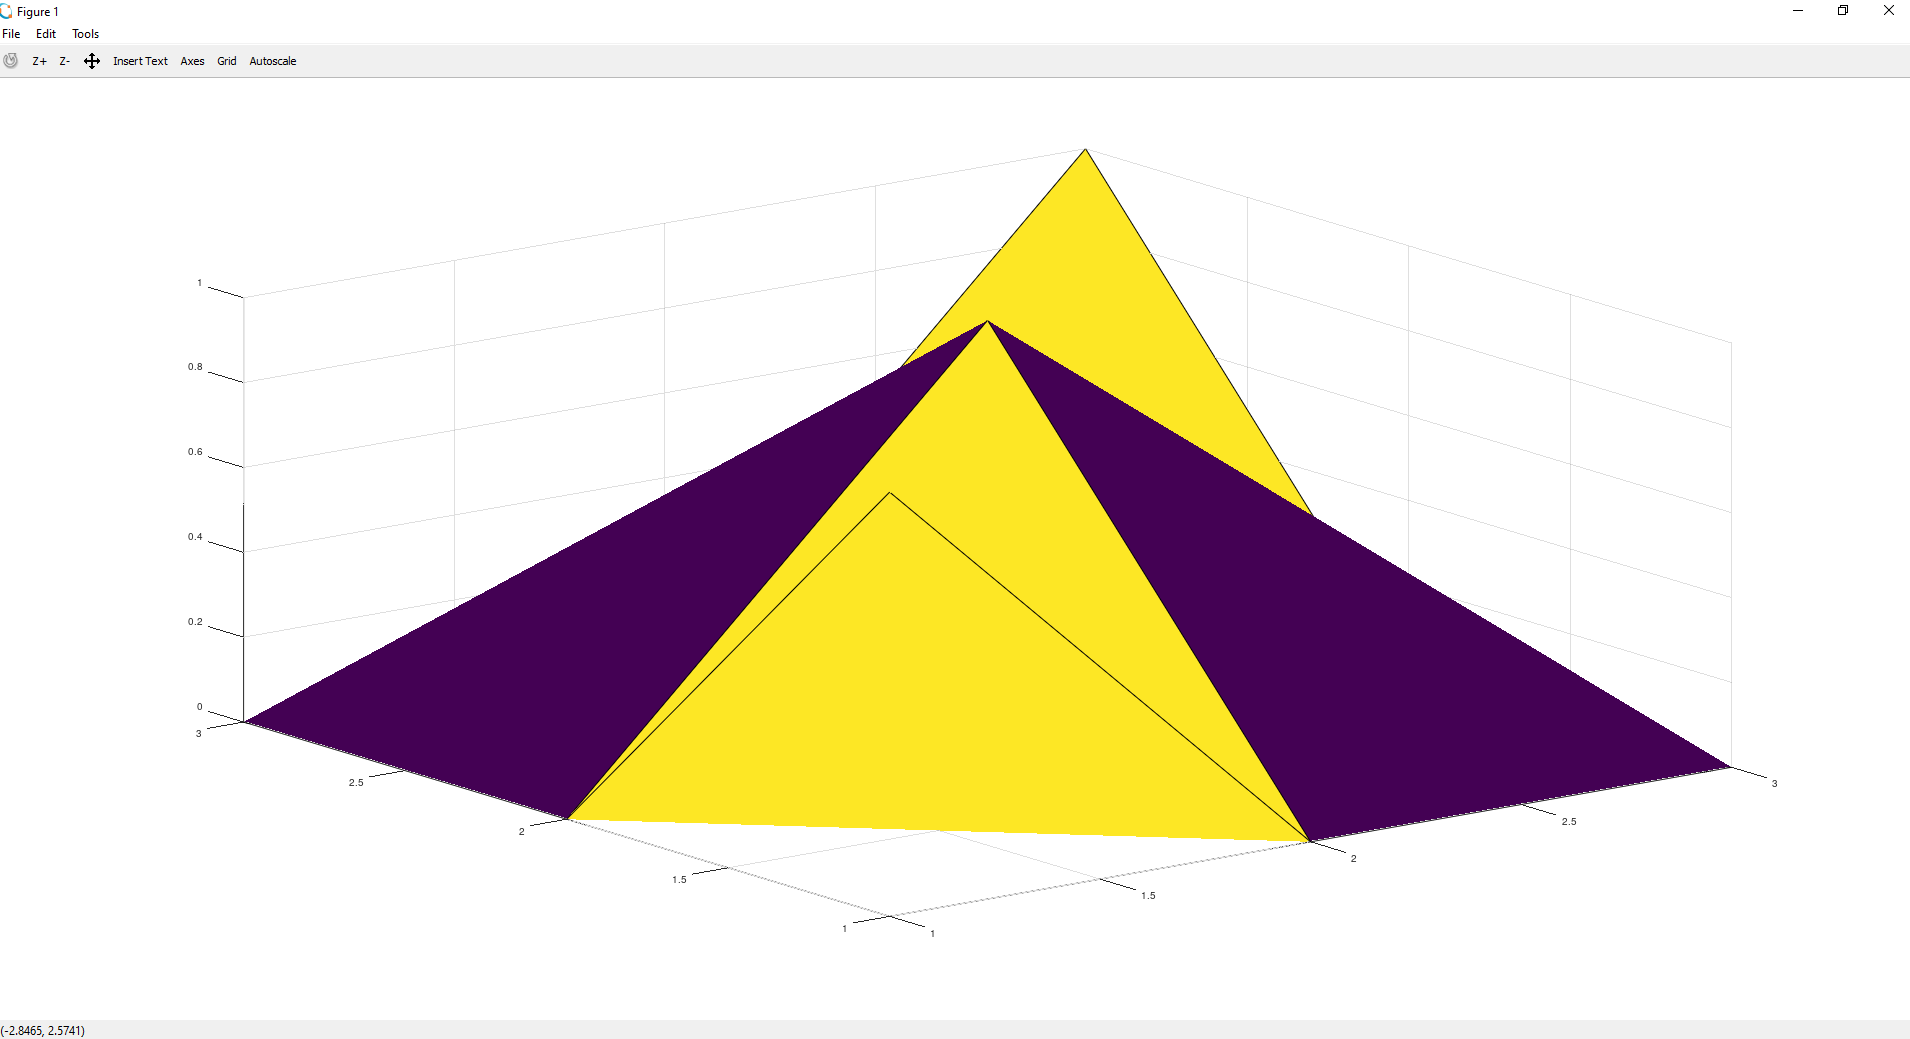
Of course, it’s possible to draw more complex functions. Octave provides really good documentation, so I encourage you to check and play with plot3, meshgrid, surf, sombrero functions. It’s a good exercise.
当然,可以绘制更复杂的函数。 Octave提供了非常好的文档,因此,我建议您检查并使用plot3 , meshgrid , surf和sombrero函数。 这是一个很好的练习。
For some of the functions mentioned above Octave also provides some test plot function, you can quickly see the result just by calling them without any parameters. Here are some examples:
对于上面提到的某些功能,Octave还提供了一些测试图功能,您可以通过不带任何参数的调用而快速查看结果。 这里有些例子:
有用的把戏 (Useful trick)
For the last point of this crash course, I’ll share functionality which is really useful while filtering your data. You can use it on the vector or matrix of predictions from your Machine Learning classifier and decide about labels of given objects. Another example is applying a given threshold to your data or removing and extracting anomalies.
对于本速成课程的最后一点,我将分享在过滤数据时非常有用的功能。 您可以将其用于机器学习分类器的预测矢量或预测矩阵,并确定给定对象的标签。 另一个示例是将给定阈值应用于数据或删除和提取异常。
Let’s assume we have a predictions vector containing 0 and 1 as labels for different objects. To find the indices of a given label you can use find function and define a condition as its parameter. To understand it better, let’s check the following example:
假设我们有一个包含0和1的预测向量作为不同对象的标签。 要查找给定标签的索引,可以使用find函数并将一个条件定义为其参数。 为了更好地理解它,让我们检查以下示例:

How does it work? The condition passed to find function is used to return all indices of elements that are greater than 0. Then we can use those indices to extract elements from the predictions vector. That’s it!
它是如何工作的? 传递给find函数的条件用于返回大于0的元素的所有索引。然后,我们可以使用这些索引从预测向量中提取元素。 而已!
概要 (Summary)
After completing this short tutorial you have the knowledge which should give you a kick start to the Octave environment. You know how to define and load data, how to perform operations on vectors and matrices, and how to visualize your work.
完成本简短教程后,您将掌握使您开始Octave环境的知识。 您知道如何定义和加载数据,如何对向量和矩阵执行操作,以及如何可视化工作。
I encourage you to use Octave whenever you came up with an idea and you need a rich yet straightforward environment to prototype it, and your full-blown Python setup is out of the reach.
我鼓励您在构思一个想法时需要使用Octave,并且需要一个丰富而直接的环境来对其进行原型设计,而完善的Python设置已无济于事。
Bibliography:
参考书目:
翻译自: https://towardsdatascience.com/octave-scientific-programming-language-crash-course-2ab8d864a01d
倍频程频谱


 1343
1343


 被折叠的 条评论
为什么被折叠?
被折叠的 条评论
为什么被折叠?
 到【灌水乐园】发言


