


车祸gif
(Traffic Fatalities in USA (2015))
(美国的交通事故死亡人数(2015))
This project is our third project in the data science Bootcamp where we receive training under the leadership of Zekeriya Besiroglu. We developed this project together with Adnan Kilic. Our goal was creating a model using supervised learning techniques and improving our database skills by storing data in PostgreSQL and doing some of our analysis there. We selected Traffic Fatalities topic-based dataset. Traffic fatalities dataset is released by the National Highway Traffic Safety Administration (NHTSA).
该项目是我们在数据科学训练营中的第三个项目,在Zekeriya Besiroglu的领导下我们接受了培训。 我们与Adnan Kilic共同开发了此项目。 我们的目标是使用监督学习技术创建一个模型,并通过将数据存储在PostgreSQL中并在其中进行一些分析来提高数据库的技能。 我们选择了基于交通死亡人数主题的数据集。 交通事故数据集由美国国家公路交通安全管理局(NHTSA)发布。
Here is the kaggle competition link of this dataset; https://www.kaggle.com/nhtsa/2015-traffic-fatalities
这是此数据集的kaggle竞争链接; https://www.kaggle.com/nhtsa/2015-traffic-fatalities
一步步 (Step By Step)
To Create PostgreSQL Database with using command line and connect it with Anaconda Jupyter.
使用命令行创建PostgreSQL数据库并将其与Anaconda Jupyter连接。
There are 17 tables in this dataset. I will be explaining how to create a database with the command line over the “damage” table I chose. I want to underline that I use Windows 7 and I select Anaconda Prompt for using command line commands.
该数据集中有17个表。 我将在我选择的“损坏”表上解释如何使用命令行创建数据库。 我想强调的是,我使用Windows 7,并且选择Anaconda Prompt来使用命令行命令。
a) Go to the path which you dowloading PostreSQL and go into “bin” file. Copy this path.
a)转到下载PostreSQL的路径,然后进入“ bin”文件。 复制此路径。
For me; this path is ; C:\Program Files\PostgreSQL\13\bin
为了我; 这条路是; C:\ Program Files \ PostgreSQL \ 13 \ bin
b) Open the command line and go to the path we copied above.
b)打开命令行并转到上面复制的路径。
(base) C:\Users\Hp> cd C:\Program Files\PostgreSQL\13\binc) Type this command;
c)键入此命令;
(base) C:\Program Files\PostgreSQL\13\bin>psql -U postgresIf you entered password while downloading postgresql, it will ask you for password when you run this command. After entering password, if you see “postgres=#” , this means you are in the right place.
如果您在下载postgresql时输入了密码,则在运行此命令时会要求您输入密码。 输入密码后,如果看到“ postgres =#” ,则表明您在正确的位置。
d) Now, we can create our database. Let the name of our database be “deneme”.
d)现在,我们可以创建数据库。 让我们的数据库名称为“ deneme”。
Type these commands;
输入以下命令;
postgres=# CREATE DATABASE deneme;
CREATE DATABASE
postgres=# \connect deneme;
Şu anda “deneme” veritabanına “postgres” kullanıcısı ile bağlısınız.
deneme=#
Now we are in our database “deneme”, we can create our tables. As i said, although there are 17 tables in my dataset, I’ll just explain the “damage” table to show how it is done. You need to do the next steps for each table.
现在我们在数据库“ deneme”中,我们可以创建表。 就像我说的那样,尽管我的数据集中有17个表,但我只解释“损坏”表以显示它是如何完成的。 您需要为每个表执行下一步。
e) Create table and copy the csv file into it with using these commands;
e)创建表,并使用以下命令将csv文件复制到其中;
deneme=# CREATE TABLE damage ( STATE numeric, ST_CASE numeric, VEH_NO numeric, MDAREAS numeric);
CREATE TABLE
deneme=# \COPY damage FROM ‘C:\Users\Hp\Desktop\traffic\damage.csv’ DELIMITER ‘,’ CSV HEADER;
COPY 192730
Congratulations! Now you have the “damage” table.
恭喜你! 现在,您有了“损坏”表。
f) Get pandas and postgres to work together!
f)让熊猫和Postgres一起工作!
import psycopg2 as pg
import pandas as pd
import pandas.io.sql as pd_sql# Postgres info to connectconnection_args = {
 ‘host’: ‘localhost’, # To connect to our _local_ version of psql
 ‘dbname’: ‘deneme’, # DB that we are connecting to
 ‘port’: 5432 # port we opened on AWS
}
connection = pg.connect(dbname=’deneme’, user=’postgres’, password=’sifre')
Now we can start to write queries, join tables etc.
现在我们可以开始编写查询,联接表等。
2) Features Selection
2)功能选择
After connecting our database, we examine in detail each table.
连接数据库后,我们将详细检查每个表。
Our target variable is the car accident in USA is day-time or night-time. We created datetime column and according to hours in that column, we create our target variable column which has 0(night-time) and 1(day-time). Since our target variable is balanced ( Class 0(gece): 17373 , Class 1(gündüz): 14793) , we did not need to apply methods such as “oversampling”.
我们的目标变量是白天或晚上在美国发生的车祸。 我们创建了datetime列,并根据该列中的小时数创建了目标变量列,该列的值为0(夜间)和1(白天)。 由于我们的目标变量是平衡的(类别0(gece):17373,类别1(gündüz):14793),因此我们无需应用“过采样”之类的方法。
We select 14 features by using these tables ; Accident , Person , Distract , Cevent , Vision , Manuever , Vehicle.
我们使用这些表选择14个特征; 事故,人,分心,事件,视觉,手动,车辆。
3)Feature Engineering
3)特色工程
a) Drunk_dr feature had 4 values ; 0 , 1 , 2 and 3. This is beacuse in each unique case, there are more than 1 people, so there could be more than 1 people who is drunk. Whether or not there are drunk people is an important variable for our model, not how many drunk people there are. With that logic, we transform 2 and 3 as 1.
a)Drunk_dr功能具有4个值; 0,1,2和3。这是因为在每种不同的情况下,都有超过1个人,因此可能有超过1个人喝醉了。 对于我们的模型,是否有醉酒的人是一个重要的变量,而不是有多少醉酒的人。 按照这种逻辑,我们将2和3转换为1。
b) We make dummies these features; day_week , month, drunk_dr ,weather.
b)我们使这些功能成为假人; day_week,月份,dunk_dr,天气。
c) Car model year can’t have values bigger than 2006 because that dataset is from 2005. We convert the values which are bigger than 2006 with median of the mod_year variable. After that we create 7 grups as;
c)汽车模型年份的值不能大于2006,因为该数据集来自2005年。我们使用mod_year变量的中位数转换大于2006的值。 之后,我们将创建7个组。
> 1990 = 0
> 1990 = 0
> 1990 & <= 1992 = 1
> 1990&<= 1992 = 1
> 1992 & <= 1994 = 2 etc.
> 1992&<= 1994 = 2等
d) There were age values bigger than 130. We convert them with the median of age column.After that we create 9 groups as
d)年龄值大于130。我们使用“年龄中值”列将其转换。之后,我们创建了9组
<= 11 = 0
<= 11 = 0
> 11 & <= 18 = 1
> 11&<= 18 = 1
> 18 & <= 22 = 2 etc.
> 18&<= 22 = 2等
e) We applied label enconding for state, mdrdstrd and mdrmanav features.
e)我们对状态,mdrdstrd和mdrmanav功能应用了标签编码。
4)EDA
4)EDA

With using plotly library, we create a Choropleth Map. It shows the number of cases for each state in USA in 2015. The code of this map is as follows;
通过使用plotly库,我们创建了一个Choropleth Map。 它显示了2015年美国各州的病例数。此地图的代码如下:
data = [dict(
 type = ‘choropleth’,
 locations = mapt[‘states’],
 locationmode = ‘USA-states’,
 z = mapt[‘st_case’],
 marker = dict(
 line = dict(
 color = ‘rgb(255, 255, 255)’,
 width = 2)
 )
 ) ,
 dict(
 type = ‘scattergeo’,
 locations = mapt[‘states’],
 locationmode = ‘USA-states’,
 text=mapt[‘states’],
 mode = ‘text’ ,
 textfont=dict(
 family=”sans serif”,
 size=13,
 color=”Orange”
 ) ) ]layout = dict( title=’Density of Traffic Accidents per State in USA(2015)’,
 geo = dict(
 scope = ‘usa’,
 projection = dict(type = ‘albers usa’),
 countrycolor = ‘rgb(255, 255, 255)’,
 showlakes = True,
 lakecolor = ‘rgb(255, 255, 255)’)
 )figure = dict(data = data, layout = layout)
iplot(figure)
We see that after 12 am. ,the number of cases increases and for weekday-wise, friday is worst.
我们看到上午12点以后。 ,案件数量增加,对于平日而言,星期五最糟糕。

About state-wise drunk driving and number of accident, Texas and California take the lead. It seems that drunking and number of accident have really strong correlation.
关于州明智的酒后驾车和事故数量,德克萨斯州和加利福尼亚州处于领先地位。 似乎醉酒与事故数量之间确实存在很强的相关性。
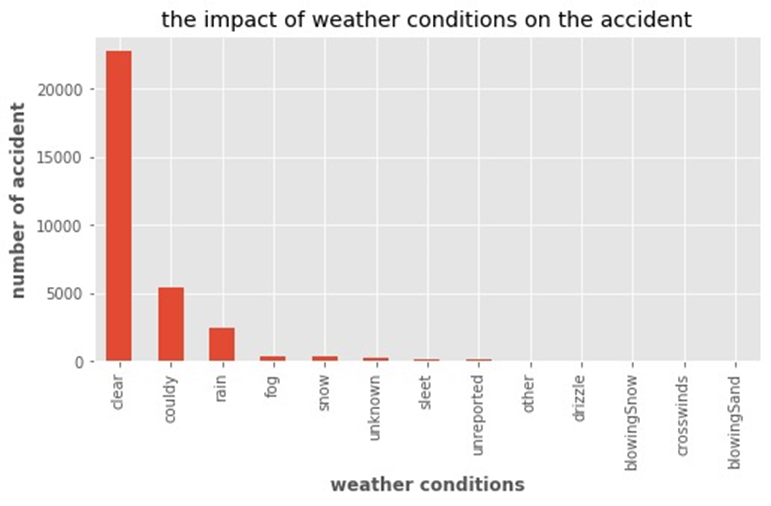
It shows that most of accidents happen when the weather is clear.
它表明大多数天气事故发生在天气晴朗时。
5) To Apply Supervised Learning Models
5)应用监督学习模型
We applied 5 different models. These are CatBoost Classifier, KNeigbors Classifier, Random Forest Classifier, Decision Tree Classifier and Logistic Regression. For each model we found best parameters and applied GridSearchCV. With this way we can handle with overfitting.
我们应用了5种不同的模型。 这些是CatBoost分类器,KNeigbors分类器,随机森林分类器,决策树分类器和Logistic回归。 对于每种模型,我们找到了最佳参数并应用了GridSearchCV。 通过这种方式,我们可以处理过度拟合。
For prediction the car accident happens the night-time or day-time, best model is Cat Boost Classifier. When we observe feature importance for this classifier, we see that age and drunk features are really important.
为了预测车祸发生在夜间或白天,最好的模型是Cat Boost分类器。 当我们观察到此分类器的特征重要性时,我们会发现年龄和酒后驾车的功能确实很重要。
CatBoostClassifier: Accuracy: 68.5421%
CatBoostClassifier:准确度:68.5421%
KNeighborsClassifier: Accuracy: 54.9891%
邻居分类器:准确度:54.9891%
RandomForestClassifier: Accuracy: 67.5474%
RandomForestClassifier:准确度:67.5474%
DecisionTreeClassifier: Accuracy: 66.5527%
DecisionTreeClassifier:准确性:66.5527%
LogisticRegression: Accuracy: 65.8067%
Logistic回归:准确度:65.8067%


Thanks for reading!
谢谢阅读!
车祸gif


 3261
3261

 被折叠的 条评论
为什么被折叠?
被折叠的 条评论
为什么被折叠?
 到【灌水乐园】发言


