


 本文适合编程初学者,旨在通过使用Python和Kaggle数据集,介绍如何进行情感分析,预测Amazon Echo评论的正面或负面。首先,文章介绍了所需的库如Pandas、NumPy和可视化库,接着演示如何导入数据、查看数据和进行数据可视化。然后,通过特征工程对数据进行预处理,最后使用随机森林分类器训练和测试模型,评估模型性能。
This article is for those dummies like me, who’ve never tried to know what machine learning was or have left it halfway for the sole reason of being overwhelmed. Follow through every line and stay along. I promise you’d be quite acquainted with giving yourself your first project on your resume.
Ť他的文章是为那些傻瓜像我一样,谁从来没有试过才知道什么机器学习是或已经离开它对于中途被淹没的唯一原因。 遵循每一条线并保持下去。 我保证您会非常熟悉在简历上给自己的第一个项目。
基本要领 (Basic Essentials)
We’d be doing the whole project in Python. The only essential is for you to understand basic programming. Nothing else is required. I prefer using Jupyter Notebook as an IDE as it helps in visualizing easier.
我们将用Python完成整个项目。 唯一的必要条件是您了解基本编程。 没有其他要求。 我更喜欢将Jupyter Notebook用作IDE,因为它有助于简化可视化过程。
介绍 (Introduction)
In this project, we shall make it interesting by using the data of the newly released Amazon Echo. Various customers who’ve bought the new Amazon Echo have submitted their reviews. We aim to predict whether a given review is positive or negative, through sentiment analysis. Sounds cool right? We shall use a dataset from Kaggle developed by Manu Siddhartha.
在这个项目中,我们将使用新发布的Amazon Echo的数据来使其有趣。 购买了新的Amazon Echo的各种客户都提交了评论。 我们旨在通过情感分析来预测给定的评论是正面还是负面。 听起来不错吧? 我们将使用Manu Siddhartha开发的Kaggle的数据集。
导入库 (Importing Libraries)
Your first step is to import libraries. Libraries help us in increased functionality and reduce the bulkiness of the code. Type this into your first cell and press shift+enter.
第一步是导入库。 库可以帮助我们增加功能并减少代码的庞大性。 在您的第一个单元格中键入内容,然后按shift + enter 。
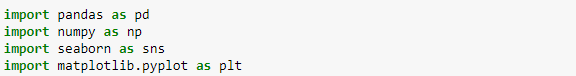
Pandas is a software library written for python. We shall use it for data manipulation and make our calculations easier.
Pandas是为python编写的软件库。 我们将使用它进行数据处理,并使我们的计算更加容易。
NumPy is a high-performance library which we shall use to perform functions on the datasets and array.
NumPy是一个高性能的库,我们将使用它来对数据集和数组执行功能。
Seaborn and Matplotlib are visualization libraries. They help in providing insane visualizations where we shall derive our insights.
Seaborn和Matplotlib是可视化库。 它们有助于提供疯狂的可视化效果,从中我们可以得出自己的见解。
When we say ‘as’ in the code above, we imply that the name of the library shall be called as the text mentioned, for ease of effort.
当我们在上面的代码中用“ as”表示时,我们的意思是为了方便起见,库的名称应称为所提到的文本。
导入数据集 (Importing Dataset)
We shall use a Kaggle dataset. Use the link below to download the dataset into your project folder.
我们将使用Kaggle数据集。 使用下面的链接将数据集下载到您的项目文件夹中。
After you download, type the following and press shift+enter to import the dataset.
下载后,键入以下内容,然后按shift + enter导入数据集。
echo = pd.read_csv(‘amazon_alexa.tsv’,sep=’\t’)
echo = pd.read_csv('amazon_alexa.tsv',sep ='\ t')
echo =: We assign the dataset to variable named echo
echo =:我们将数据集分配给名为echo的变量
sep=’\t’: The dataset contains values separated by a tab ( tsv files ).We use the sep argument to mention the separation.
sep ='\ t':数据集包含由制表符分隔的值(tsv文件)。我们使用sep参数来提及分隔。
‘amazon_alexa.tsv’: If the file is in any other place than the Jupyter Notebook folder, mention the path of the file followed by /amazon_alexa.tsv inside the quotes.
'amazon_alexa.tsv':如果文件位于Jupyter Notebook文件夹以外的任何其他位置,请在引号中提及文件的路径,后跟/amazon_alexa.tsv 。
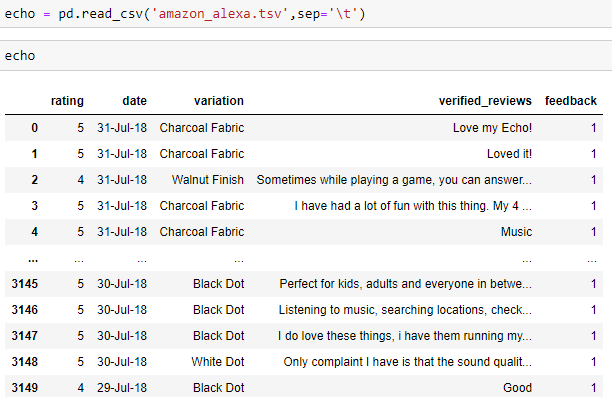
Type echo in the cell below and you shall see the dataset you’ve imported.
在下面的单元格中键入echo,您将看到导入的数据集。
The dataset consists of the rating given, date of review, model variation, the reviews that the customers have written, and the feedback. Here, 1=positive and 0=negative. The column feedback shall be our target.
数据集包括给定的评级,审查日期,模型变化,客户撰写的审查以及反馈。 在此,1 =正,0 =负。 列反馈将是我们的目标。
查看您的数据集 (Viewing your dataset)
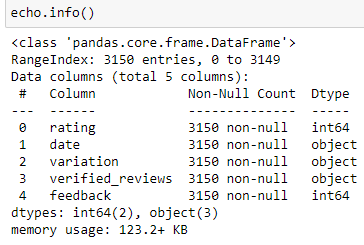
Technical information on your dataset is essential as it helps us understand what we’re dealing with. Use the following codes in the images below.
您的数据集上的技术信息至关重要,因为它可以帮助我们了解我们正在处理的内容。 在下面的图像中使用以下代码。
 最低0.47元/天 解锁文章


 3276
3276


 被折叠的 条评论
为什么被折叠?
被折叠的 条评论
为什么被折叠?
 到【灌水乐园】发言


