import numpy as np
import pandas as pd
import matplotlib.pyplot as plt
1.读取数据
train = np.genfromtxt('data.csv', delimiter=',')# 提取 train 中的两列数据 作为X , y
X = train[:,0]
y = train[:,1]
# 画出散点图
plt.scatter(X, y)
plt.show()
2.定义损失函数
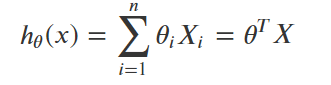
拟合函数
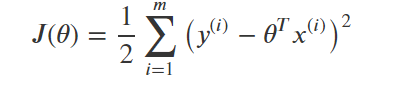
损失函数
# 定义损失函数defloss_function(w, b, train):
total_cost =0.0
M =len(train)# 逐点计算损失函数的值for i inrange(M):
x = train[i,0]
y = train[i,1]
total_cost +=(y - w * x - b)**2return total_cost /(2* M)
3.定义模型的超参数
alpha =0.0001# 学习率
init_w =0# 初始的 w 参数值
init_b =0# 初始的 b 的参数值
num_iter =10# 迭代次数
4.使用梯度下降计算参数
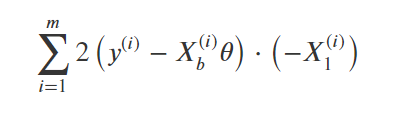
求导公式
defgrad_desc(train, init_w, init_b, alpha, num_iter):
w = init_w
b = init_b
# 记录下降过程中损失函数的值
cost_values =[]for i inrange(num_iter):# 记录下降过程中顺势函数的值
cost_values.append(loss_function(w, b, train))# 梯度下降 注意这个传入的是 w, 和 b
w, b = setp_grad_desc(train, w, b, alpha)return[w, b, cost_values]defsetp_grad_desc(train, current_w, current_b, alpha):
sum_grad_w =0# 对 w 的导数求和
sum_grad_b =0# 对 b 的导数求和
M =len(train)# 计算导数和for i inrange(M):
x = train[i,0]
y = train[i,1]
sum_grad_w +=(current_w * x + current_b - y)* x
sum_grad_b += current_w * x + current_b - y
# 使用公式计算当前梯度
grad_w = sum_grad_w / M
grad_b = sum_grad_b / M
# 更新当前 w 和 b的值
update_w = current_w - alpha * grad_w
update_b = current_b - alpha * grad_b
return update_w, update_b
# 使用梯度下降计算
w, b, cost_values= grad_desc(train, init_w, init_b, alpha, num_iter)print("w is :", w)print("b is :", b)# 计算损失函数
cost = loss_function(w, b, train)print("cost is :", cost)# 画出梯度下降的数据图
plt.plot(cost_values)
plt.show()
w is : 1.394730441275591
b is : 0.027713586724842688
cost is : 130.31761996260104
5.画出拟合曲线
x = train[:,0]
y = train[:,1]
plt.scatter(x, y)
pre_y = w * x + b
plt.plot(x, pre_y , color='r')


 342
342


 被折叠的 条评论
为什么被折叠?
被折叠的 条评论
为什么被折叠?
 到【灌水乐园】发言


