


matplotlib 显示两张图片,折线图 和 scipy
显示两张图片的代码:
import numpy as np
from scipy.misc import imread, imsave, imresize
import matplotlib.pyplot as plt


img = imread('cat.jpg')
print(img.dtype, img.shape)  # uint8 (500, 500, 3)

img_tinted = img * [1, 0.1, 0.5]  # RGB
img_tinted = imresize(img_tinted, (300, 600))
imsave('cat_tinted.jpg', img_tinted)

plt.subplot(1, 2, 1)
plt.imshow(img)

plt.subplot(1, 2, 2)
plt.imshow(img_tinted)

plt.show()
显示结果:

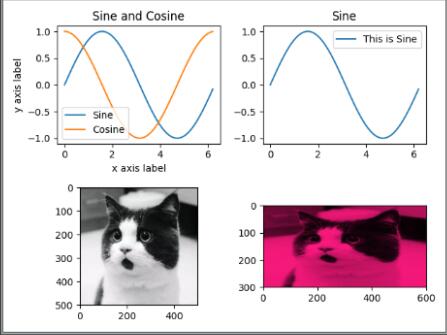
显示四张图片的代码:
x = np.arange(0, 2 * np.pi, 0.1)
y_sin = np.sin(x)
y_cos = np.cos(x)

plt.subplot(2, 2, 1)
plt.plot(x, y_sin)
plt.plot(x, y_cos)
plt.xlabel('x axis label')
plt.ylabel('y axis label')
plt.title('Sine and Cosine')
plt.legend(['Sine', 'Cosine'])

plt.subplot(2, 2, 2)
plt.plot(x, y_sin)
plt.title('Sine')
plt.legend(['This is Sine'])

# img = imread('cat.jpg')
plt.subplot(2, 2, 3)
plt.imshow(img)

plt.subplot(2, 2, 4)
plt.imshow(np.uint8(img_tinted))

plt.show()
显示结果:
计算任意两点间的欧氏距离
from scipy.spatial.distance import pdist, squareform
x= np.array([[0, 1], [1, 0], [2, 0]])
d= squareform(pdist(x, 'euclidean'))
print(d)
[[0. 1.41421356 2.23606798]
[1.41421356 0. 1. ]
[2.23606798 1. 0. ]]
posted @ 2019-02-24 20:26 YangZhaonan 阅读(...) 评论(...) 编辑 收藏


 571
571

 被折叠的 条评论
为什么被折叠?
被折叠的 条评论
为什么被折叠?
 到【灌水乐园】发言


