


主要流程;
1 先把SA-1B数据集的.json文件读进来
2 通过coco自带的api将其RLE格式的segmentation的值转成mask格式
此处科普一下:
RLE: 用来表示目标在图像中的像素位置信息
coco数据集中,RLE格式用一个字典表示,包含两个字段:'size' 和 'counts'。'size' 是一个表示图像大小的列表,包含图像的高度和宽度。'counts' 是一个经过压缩的字节串,表示图像的二进制掩码,通过使用COCO API的函数,你可以将RLE格式解码为标准的Mask格式,也就是一个二维数组。
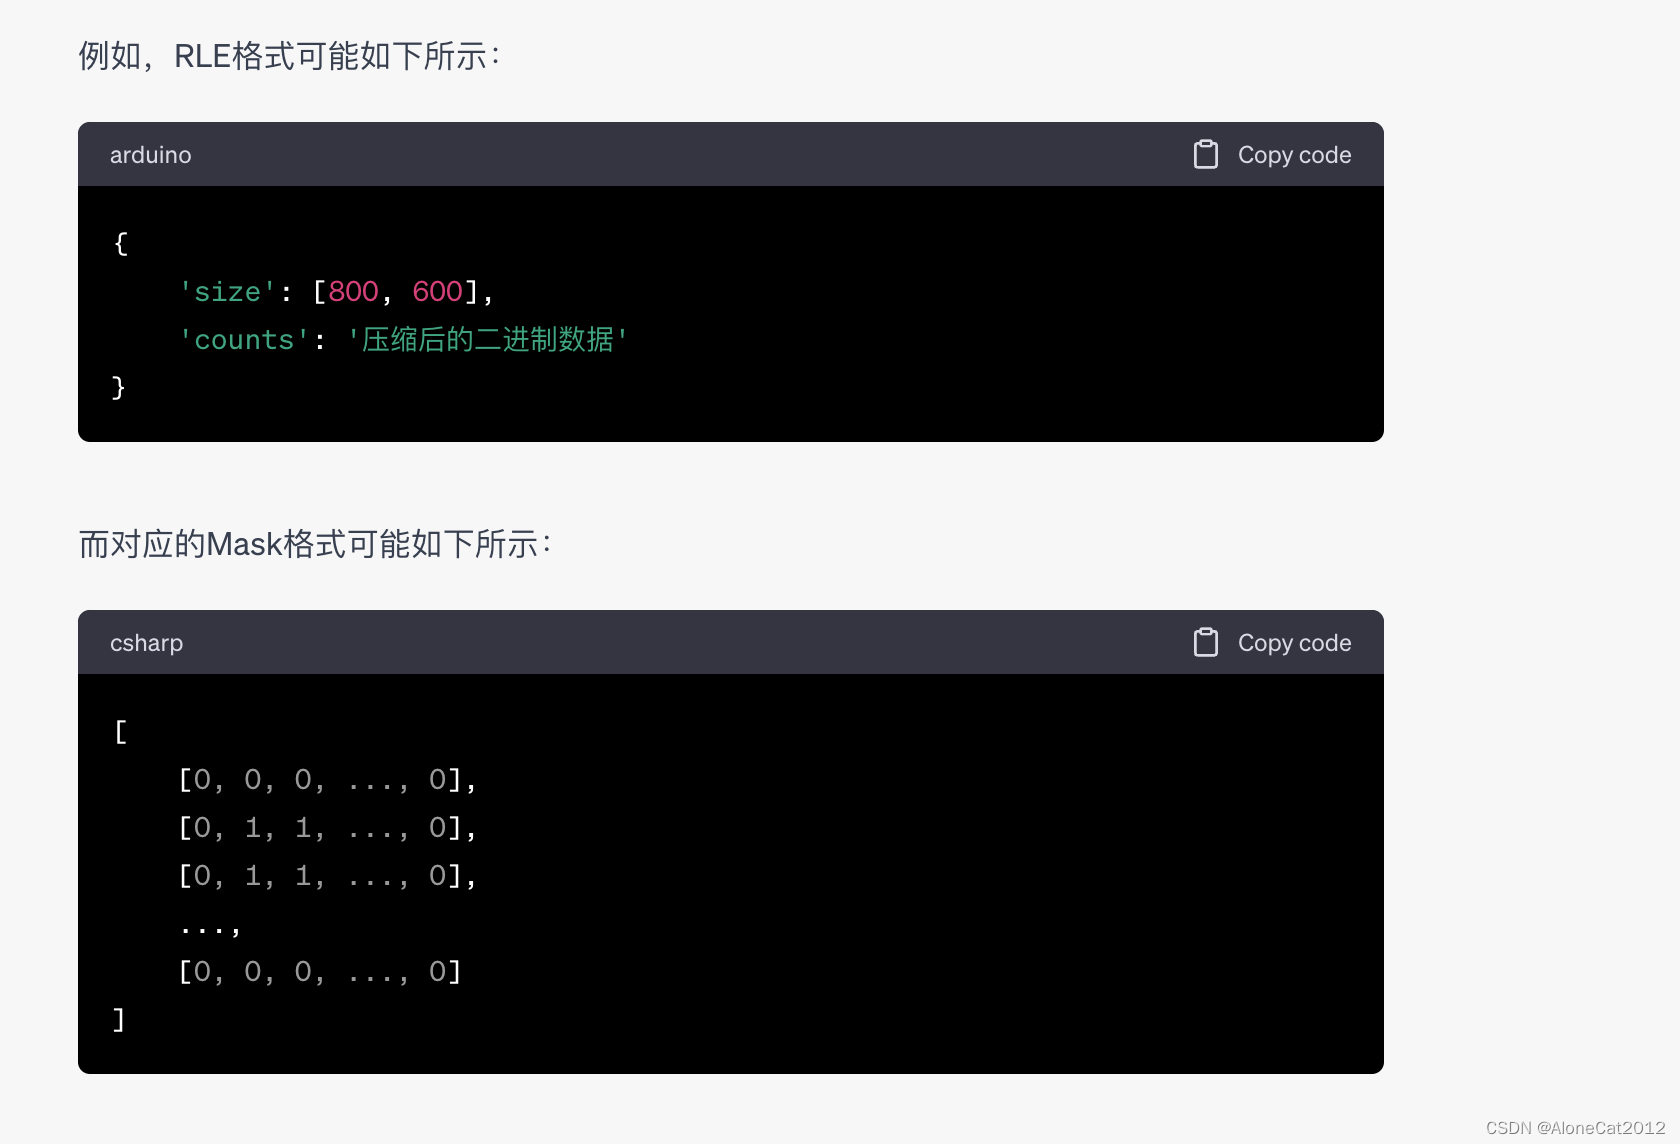
mask数组:
Mask格式是一种用于表示图像中目标位置的格式。它通常是一个二维数组(矩阵),与原始图像大小相同,其中的元素值为1表示该像素属于目标,值为0表示该像素不属于目标。Mask格式与目标在图像中的像素位置一一对应,因此可以准确地表示目标的形状。
3 将mask数组转成polygon坐标
4 归一化,写入.txt文件
Note:中途可以将其可视化以验证,代码如下
import random

import numpy as np
import cv2
from pycocotools import mask as coco_mask
import json
import matplotlib.pyplot as plt
import time
import os

outputpath = '/Users/outputtxt/'

def normalize_polygon_coordinates(polygon_coordinates_list,size):
normalized_polygon_coordinates_list = []

for polygon_coordinates in polygon_coordinates_list:
normalized_polygon = []
for x, y in polygon_coordinates:
normalized_x = x / size[1]
normalized_y = y / size[0]
formatted_x = format(normalized_x, '.6f')
formatted_y = format(normalized_y, '.6f')
normalized_polygon.append((formatted_x, formatted_y))
normalized_polygon_coordinates_list.append(normalized_polygon)

return normalized_polygon_coordinates_list


def write_a_line(name, arr):
for i in range(len(arr)):
for j in range(len(arr[i])):
if i==0 and j==0:
with open(outputpath + name, 'a') as file:
file.write('0')
file.write(" ")
for elements in arr[i][j]:
file.write(str(elements))
file.write(" ")
else:
with open(outputpath+name, 'a') as file:
for elements in arr[i][j]:
file.write(str(elements))
file.write(" ")
with open(outputpath + name, 'a') as file:
file.write("\n")


# 设置文件夹路径
folder_path = '/Users/Downloads/An_YmP5OIPXun-vu3hkckAZZ2s4lPYoVkiyvCcWiVY21mu1Ng5_1HeCa2CWiSTsskj8HQ8bN013HxNpYDdSC_7jWQq_svcg'
# folder_path = '/Users/Downloads/testInput'

count = 1
# 遍历文件夹内的所有文件
for filename in os.listdir(folder_path):
# 判断文件是否为JSON文件
if filename.endswith('.json'):
# 读取JSON文件并处理
file_path = os.path.join(folder_path, filename)
with open(file_path, 'r') as f:
fcc_data = json.load(f)
# if (len(fcc_data['annotations'])>11):
# continue
# if (len(fcc_data['annotations'])<10):
# print(len(fcc_data['annotations']))
# print(str(file_path))
for i in range(len(fcc_data['annotations'])):
data = fcc_data['annotations'][i]
mask = np.array(coco_mask.decode(data['segmentation']), dtype=np.uint8)
size = data['segmentation']['size']
contours, _ = cv2.findContours(mask, cv2.RETR_EXTERNAL, cv2.CHAIN_APPROX_SIMPLE)
polygon_coordinates_list = []

for contour in contours:
contour_points = contour[:, 0, :] # 获取每个轮廓中的像素点坐标
polygon_coordinates_list.append(contour_points)
txt_file_name = filename[:-5]+'.txt'

# plt.figure()
# plt.imshow(mask, cmap='gray')
# for polygon_coordinates in polygon_coordinates_list:
# plt.plot(polygon_coordinates[:, 0], polygon_coordinates[:, 1], 'r', linewidth=2)
# plt.axis('off')
# plt.savefig(outputpath+"myplot"+str(random.randint(0, 1000))+".png")
# print("save one pic")
# print(i)
# time.sleep(1)

polygon_coordinates_list = normalize_polygon_coordinates(polygon_coordinates_list,size)
write_a_line(txt_file_name,polygon_coordinates_list)
# print(count)


count+=1


 1万+
1万+

 被折叠的 条评论
为什么被折叠?
被折叠的 条评论
为什么被折叠?
 到【灌水乐园】发言


