


轮廓发现与绘制
cv2.findContours()
cv2.drawContours()
轮廓是沿边界的具有相似颜色或强度的所有连续点组成的曲线。
- 为了更好的精度,使用二值图像。在轮廓发现前,使用阈值法或者Canny边缘检测。
- 轮廓发现是在黑色背景中找出白色物体。
%matplotlib inline
import cv2
import numpy as np
import matplotlib.pyplot as plt
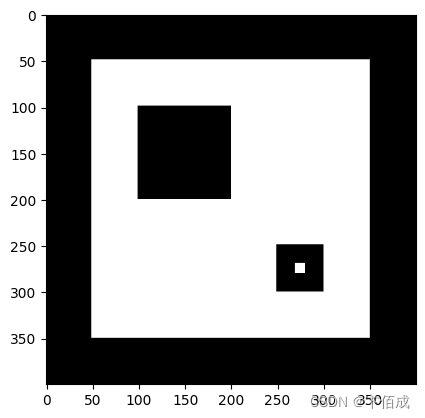
# Create test image
img = np.zeros((400, 400, 3), dtype=np.uint8)
img[49:350, 49:350] = 255
img[99:200, 99:200] = 0
img[249:300, 249:300] = 0
img[269:280, 269:280] = 255
# 绘制图像
plt.imshow(img, cmap='gray')
# 保存图像
cv2.imwrite('../data/test.jpg', img)
# 读取图像
im = cv2.imread('../data/test.jpg')
# 判断图像是否为空
assert im is not None, "file could not be read, check with os.path.exists()"
# 将图像转化为灰度图
imgray = cv2.cvtColor(im, cv2.COLOR_BGR2GRAY)
# 图像二值化
ret, thresh = cv2.threshold(imgray, 127, 255, 0)
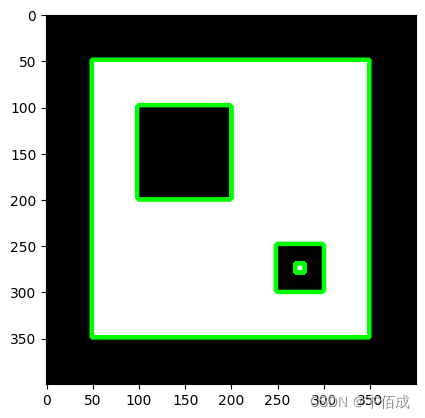
# 轮廓发现
contours, hierarchy = cv2.findContours(thresh, cv2.RETR_TREE, cv2.CHAIN_APPROX_SIMPLE)
# 所有轮廓绘制
cv2.drawContours(im, contours, -1, (0, 255, 0), 3)
plt.imshow(im)
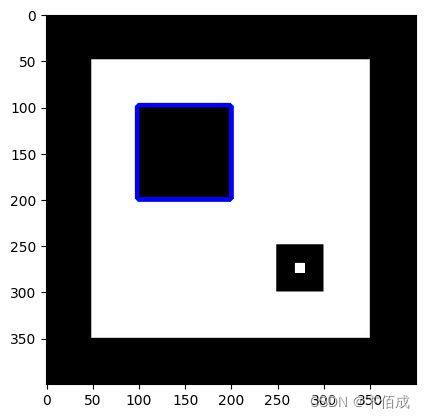
# 指定轮廓绘制
cnt = contours[3]
cv2.drawContours(im, [cnt], 0, (0, 0 , 255), 3)

# 显示图像
plt.imshow(im)
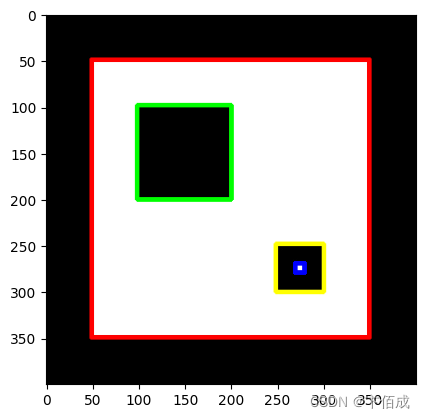
轮廓逼近法的不同
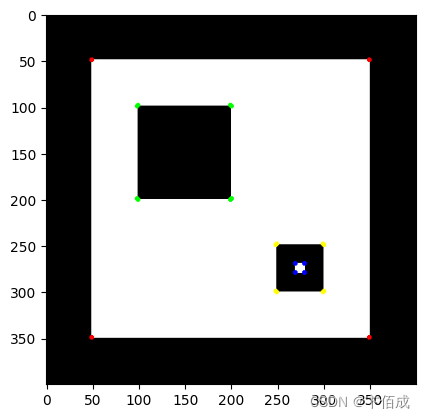
传递cv2.CHAIN_APPROX_NONE,则存储所有边界点。cv2.CHAIN_APPROX_SIMPLE会删除了所有冗余点并压缩了轮廓,从而节省了内存。
通过cv2.findContours()得到的contours是Tuple类型。在本实例中,len(contours)的值为4,代表检测到了4个轮廓,每个轮廓包含点的维度是(n, 1, 2),n代表点的个数,2表示点的二维坐标。
# 发现轮廓,并使用cv2.CHAIN_APPROX_NONE模式
contours, hierarchy = cv2.findContours(thresh, cv2.RETR_TREE, cv2.CHAIN_APPROX_NONE)

# 绘制组成轮廓的所有边界点
for i, cnt in enumerate(contours):
    for point in cnt[:, 0, :]:
    	# 不同轮廓上绘制的边界点颜色不一样
        if i == 0:
            cv2.circle(img, point, 1, (255, 0, 0), 2)
        elif i == 1:
            cv2.circle(img, point, 1, (255, 255, 0), 2)
        elif i == 2:
            cv2.circle(img, point, 1, (0, 0, 255), 2)
        else:
            cv2.circle(img, point, 1, (0, 255, 0), 2)

# 显示图像
plt.imshow(img)
# 发现轮廓,并使用cv2.CHAIN_APPROX_SIMPLE模式
contours, hierarchy = cv2.findContours(thresh, cv2.RETR_TREE, cv2.CHAIN_APPROX_SIMPLE)

# 绘制组成轮廓的所有边界点
for i, cnt in enumerate(contours):
    for point in cnt[:, 0, :]:
    	# 不同轮廓上绘制的边界点颜色不一样
        if i == 0:
            cv2.circle(img, point, 1, (255, 0, 0), 2)
        elif i == 1:
            cv2.circle(img, point, 1, (255, 255, 0), 2)
        elif i == 2:
            cv2.circle(img, point, 1, (0, 0, 255), 2)
        else:
            cv2.circle(img, point, 1, (0, 255, 0), 2)

# 显示图像
plt.imshow(img)


 1056
1056


 被折叠的 条评论
为什么被折叠?
被折叠的 条评论
为什么被折叠?
 到【灌水乐园】发言


