


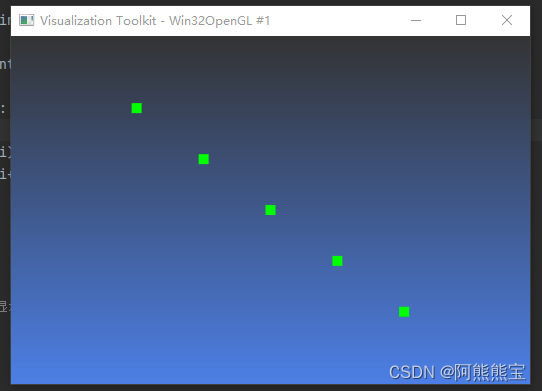
想要画线,那首先要先把点画出来。
不记得画点的话,请看第一篇。(温习一下)
points_list=[[0,0,0],[0,0,1],[0,0,2],[0,0,3],[0,0,4]]

points=vtk.vtkPoints()
vertices=vtk.vtkCellArray()
for i in points_list:
    point_id=points.InsertNextPoint(i)
    vertices.InsertNextCell(1)
    vertices.InsertCellPoint(point_id)
然后你就可以画出点了(详细请看画点篇)
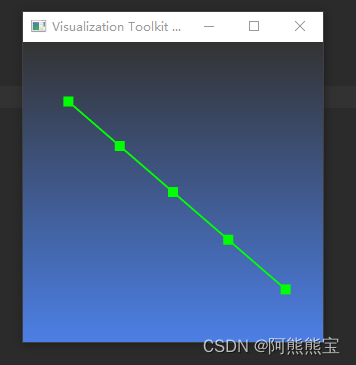
之后先说一下画线的逻辑,肯定是你刚才画出的某些点,然后将他们连起来
那么怎么把点连起来呢?
先来看一下下边的这个for循环
for i in points_list:
    point_id=points.InsertNextPoint(i)
    vertices.InsertNextCell(1)
    vertices.InsertCellPoint(point_id)
这个for循环每次执行一遍就回把某个点(比如(0,0,0))转变成vtk里来记录不同的点的编号
例如:(0,0,0):0 (0,0,1):1 (0,0,2):2
那知道了每个点的编号之后
 line=vtk.vtkLine()
 line.GetPointIds().SetId(0, i)
 line.GetPointIds().SetId(1, i+1)
这样就可以把point_id编号为i,i+1这两个点连成一条线。
so 上代码:(强烈建议,这篇和第一篇对比着看,便于理解)
顺便说一下:这篇的demo里我没有加axes_actor(第一篇里的一个演员 :坐标系)
也可以思考一下,一个ren渲染器里,如果想添加多个actor,应该如何操作
# # -*- coding: utf-8 -*-
# # !/usr/bin/env python
#
# import vtk
#
# points_list=[[1,0,0],[0,0,1],[0,0,0]]
#
# points=vtk.vtkPoints()
# vertices=vtk.vtkCellArray()
# for i in points_list:
#     point_id=points.InsertNextPoint(i)
#     vertices.InsertNextCell(1)
#     vertices.InsertCellPoint(point_id)
#
# # 创建线段类,用 point_id 将线段连起来
# line0=vtk.vtkLine()
# # 将 point_id 号为 0 1 的两个点连起来
# line0.GetPointIds().SetId(0,0)
# line0.GetPointIds().SetId(1,1)
# line1=vtk.vtkLine()
# line1.GetPointIds().SetId(0,1)
# line1.GetPointIds().SetId(1,2)
# line2=vtk.vtkLine()
# line2.GetPointIds().SetId(0,0)
# line2.GetPointIds().SetId(1,2)
#
# # 创建线段拓扑,,,,,可以和插入point点时候的拓扑写法做个对比
# # 创建线段拓扑,将三条线段放在一个cell里
# lines = vtk.vtkCellArray()
# lines.InsertNextCell(line0)
# lines.InsertNextCell(line1)
# lines.InsertNextCell(line2)
#
# # 创建几何数据对象
# polydata=vtk.vtkPolyData()
# polydata.SetPoints(points)
# # 如果去掉 vertices 会不显示顶点,只显示线段
# polydata.SetVerts(vertices)
# polydata.SetLines(lines)
#
# mapper=vtk.vtkPolyDataMapper()
# mapper.SetInputData(polydata)
#
# actor=vtk.vtkActor()
# actor.SetMapper(mapper)
# actor.GetProperty().SetPointSize(10)
# actor.GetProperty().SetLineWidth(2)
# actor.GetProperty().SetColor(0.0,1.0,0.0)
#
# ren=vtk.vtkRenderer()
# ren.SetBackground(0.8,0.3,0.8)
# ren.SetBackground(0.3,0.5,0.9)
# ren.SetGradientBackground(1)
# ren.AddActor(actor)
#
# ren_window=vtk.vtkRenderWindow()
# ren_window.SetWindowName('axiong first cube')
# ren_window.SetSize(300,300)
# ren_window.AddRenderer(ren)
#
# interactor=vtk.vtkRenderWindowInteractor()
# interactor.SetRenderWindow(ren_window)
#
# style=vtk.vtkInteractorStyleMultiTouchCamera()
# interactor.SetInteractorStyle(style)
#
# interactor.Initialize()
# ren_window.Render()
# interactor.Start()


# ----------------------------------------------------------------------------------


# -*- coding: utf-8 -*-
# !/usr/bin/env python
import vtk
points_list=[[0,0,0],[0,0,1],[0,0,2],[0,0,3],[0,0,4]]

points=vtk.vtkPoints()
vertices=vtk.vtkCellArray()
lines = vtk.vtkCellArray()
for i in points_list:
    point_id=points.InsertNextPoint(i)
    vertices.InsertNextCell(1)
    vertices.InsertCellPoint(point_id)

for i in range(len(points_list)):
    line=vtk.vtkLine()
    line.GetPointIds().SetId(0, i)
    line.GetPointIds().SetId(1, i+1)
    lines.InsertNextCell(line)

# 创建几何数据对象
polydata=vtk.vtkPolyData()
polydata.SetPoints(points)
# 如果去掉 vertices 会不显示顶点,只显示线段
polydata.SetVerts(vertices)
polydata.SetLines(lines)

mapper=vtk.vtkPolyDataMapper()
mapper.SetInputData(polydata)

actor=vtk.vtkActor()
actor.SetMapper(mapper)
actor.GetProperty().SetPointSize(10)
actor.GetProperty().SetLineWidth(2)
actor.GetProperty().SetColor(0.0,1.0,0.0)

ren=vtk.vtkRenderer()
ren.SetBackground(0.8,0.3,0.8)
ren.SetBackground(0.3,0.5,0.9)
ren.SetGradientBackground(1)
ren.AddActor(actor)

ren_window=vtk.vtkRenderWindow()
ren_window.SetWindowName('axiong first cube')
ren_window.SetSize(300,300)
ren_window.AddRenderer(ren)

interactor=vtk.vtkRenderWindowInteractor()
interactor.SetRenderWindow(ren_window)

style=vtk.vtkInteractorStyleMultiTouchCamera()
interactor.SetInteractorStyle(style)

interactor.Initialize()
ren_window.Render()
interactor.Start()
建议这两篇demo代码彻底看懂,对vtk的流程有基础的了解。
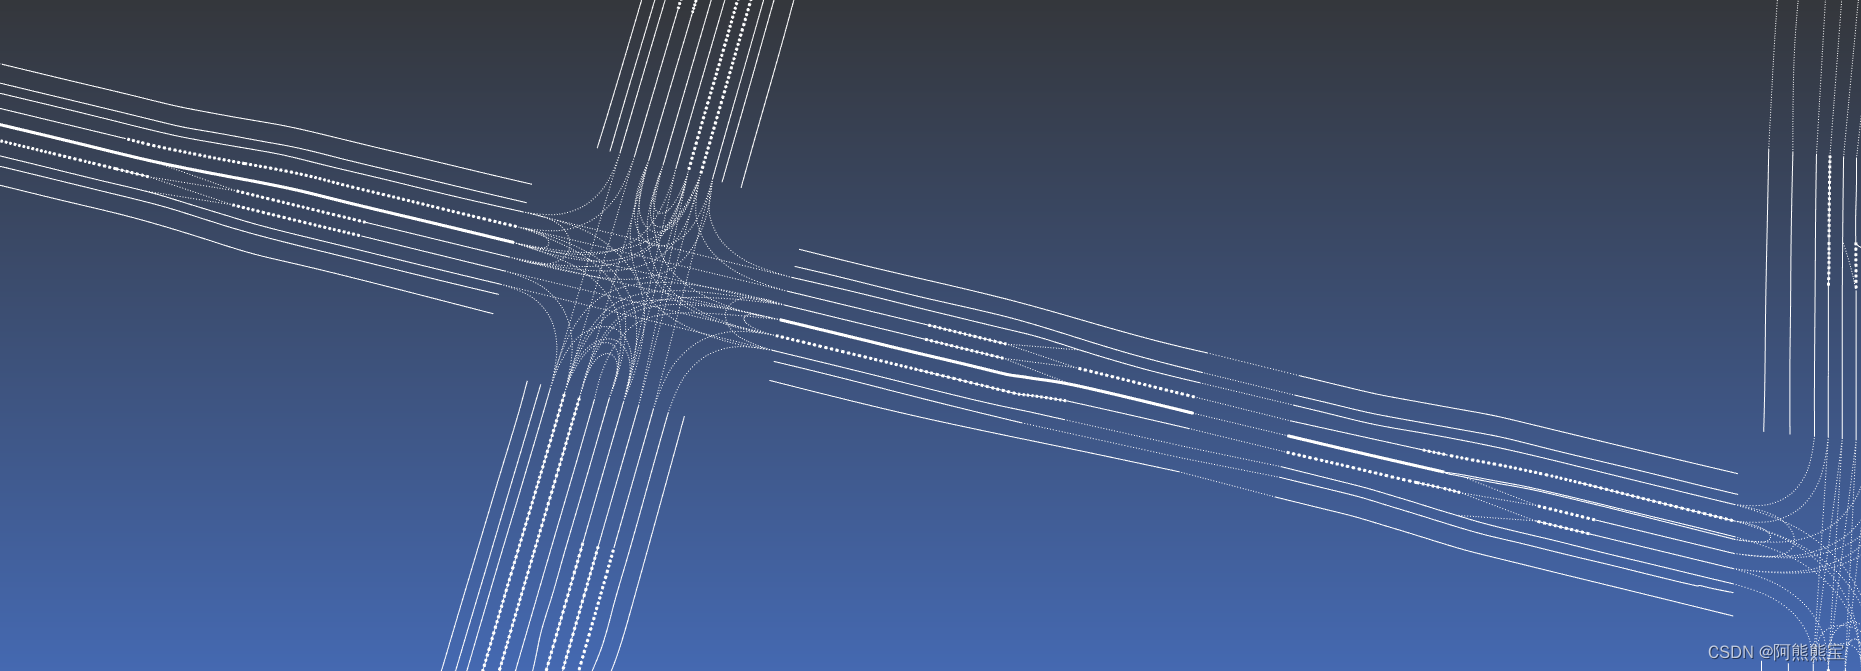
最近在做一部分自动驾驶中高精度地图显示的操作,也用到了vtk画线,所以基础打好很重要。
什么?怎么画不同的线?
实线就是point_id:0-1,1-2,2-3,3-4,,,,,,这样遍历,挨个连起来,
虚线就是point_id: 0-1,2-3,4-5,,,,,这样遍历,挨个连
线的粗细直接用接口:actor.GetProperty().SetLineWidth(line_width)
线的颜色直接用接口:actor.GetProperty().SetColor(255, 255, 255)
想显示线同时不显示点: polydata.SetVerts(vertices) 这句注释掉就可以


 3359
3359


 被折叠的 条评论
为什么被折叠?
被折叠的 条评论
为什么被折叠?
 到【灌水乐园】发言


