


👨🎓个人主页:研学社的博客
💥💥💞💞欢迎来到本博客❤️❤️💥💥
🏆博主优势:🌞🌞🌞博客内容尽量做到思维缜密,逻辑清晰,为了方便读者。
⛳️座右铭:行百里者,半于九十。
📋📋📋本文目录如下:🎁🎁🎁
目录

💥1 概述
SWIM这个名字代表浅水教学模型。求解 beta 平面上的线性化浅水方程。它被配置为再现Stommel(1948)关于风驱动的海洋环流向西加强的理论。它是墨西哥湾流等洋流的最基本模型。本文用于学习物理海洋学数值模拟的基础知识,并了解“向西强化”的概念。
📚2 运行结果
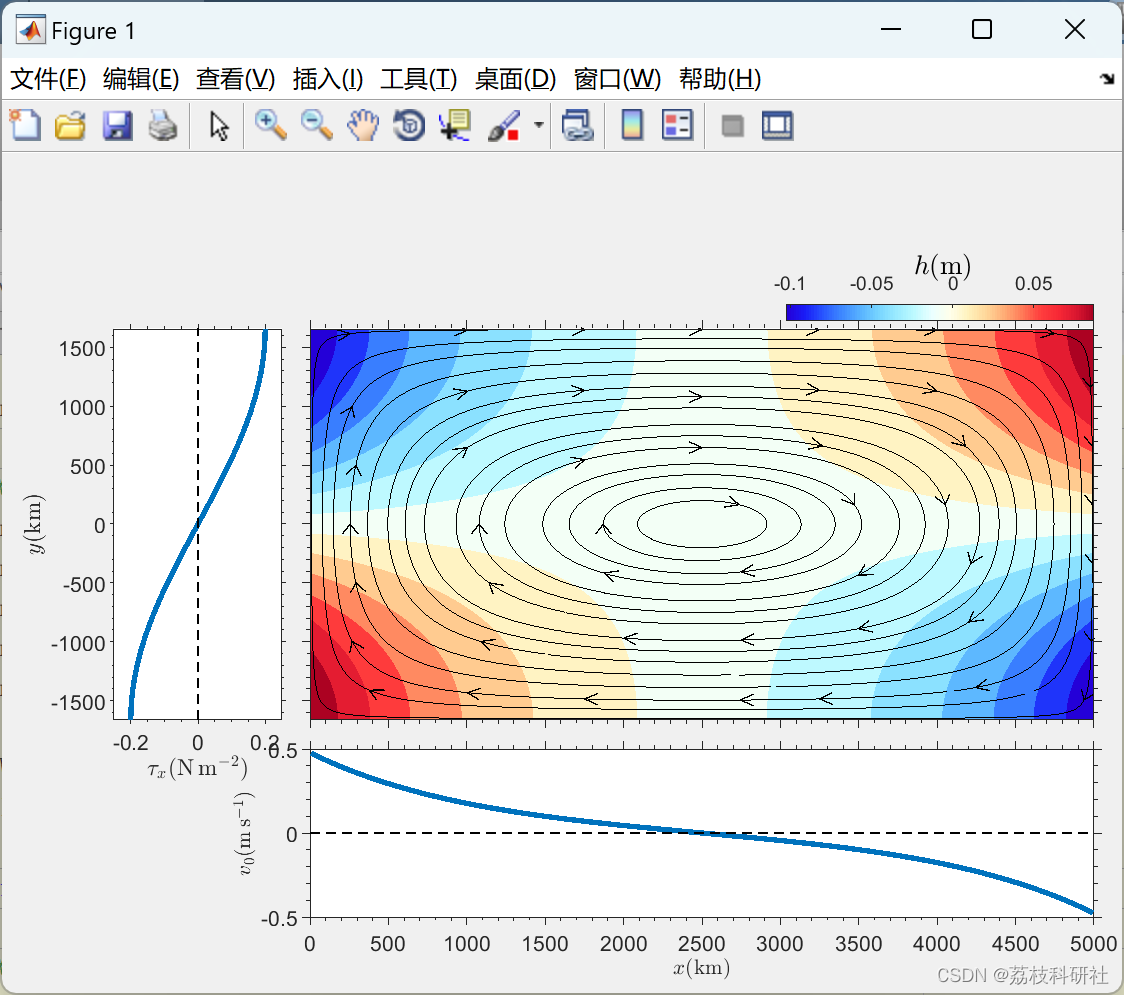
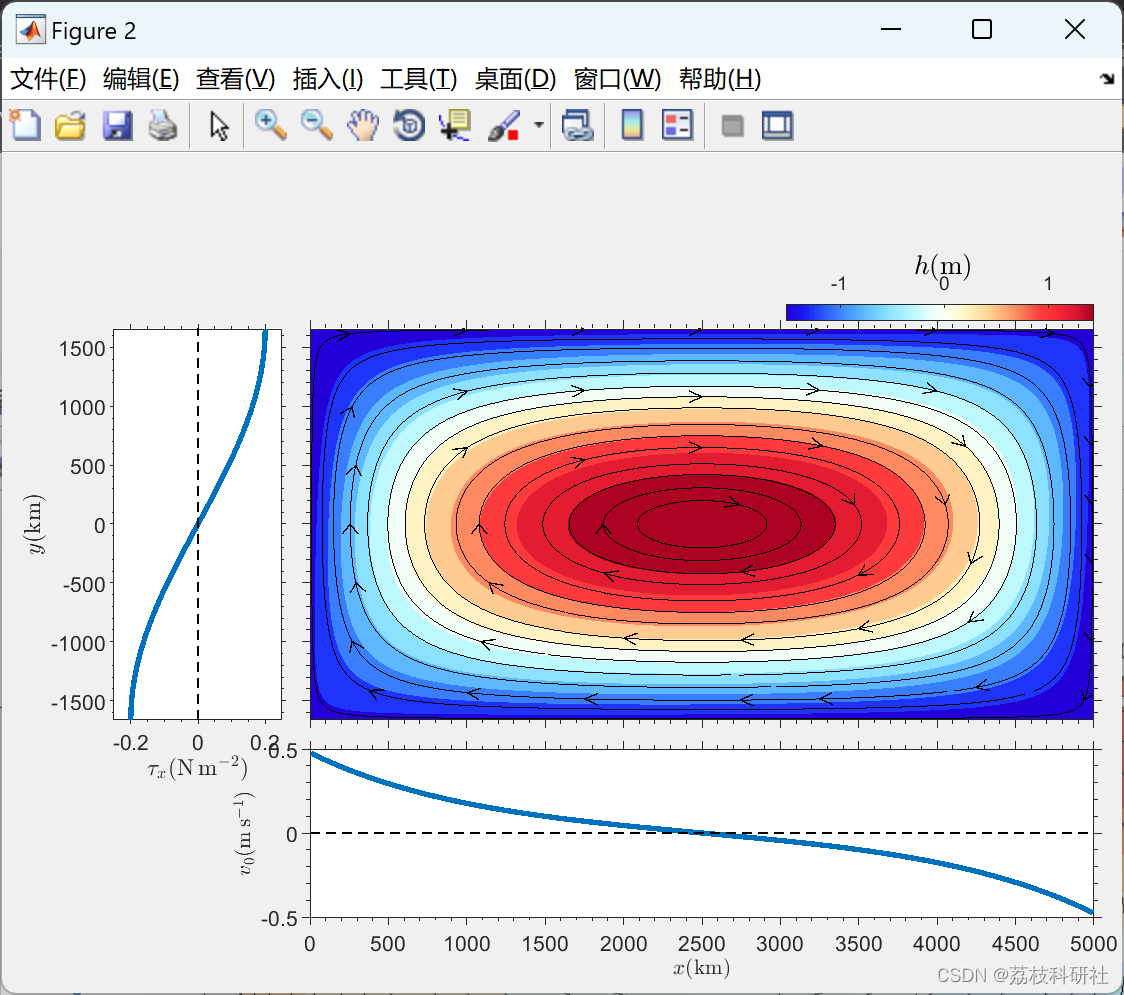
运行时间比较久喔。
部分代码:
function [] = plot_SWIM(outFname);
figure
clf;
% Load the results
load(outFname);
% Parameters
length_panel_1 = 0.15;
height_panel_1 = 0.6;
length_panel_2 = 0.70;
height_panel_2 = (Ly/Lx)*length_panel_2;
height_panel_3 = 0.2;
i0 = 0.1;
j0 = 0.075;
di = 0.025;
dj = 0.05;
fs = 8; % fontsize
lw = 2.0; % linewidth
x_h_label = 3850;
y_h_label = 2175;
% Convert to km only for plotting purposes
xu = xu/1000;
yu = yu/1000;
xv = xv/1000;
yv = yv/1000;
Ly = Ly/1000;
Lx = Lx/1000;
% Interpolate the variable at the center of each cell, that is at the
% coordinate of the elevation h.
[Xu,Yu] = meshgrid(xu,yu);
[Xv,Yv] = meshgrid(xv,yv);
[Xh,Yh] = meshgrid(xv,yu);
uh = interp2(Xu,Yu,u',Xh,Yh);
vh = interp2(Xv,Yv,v',Xh,Yh);
xh = xv;
yh = yu;
% v at y = 0
v0 = vh(round(N/2),:);
% Colormap
load blue_red_cmap.mat;
%% Wind stress
axes('Position',[i0 j0+height_panel_3+dj length_panel_1 height_panel_2])
plot(tau_x(1,:),yh,'linewidth',lw);
hold;
plot([0 0],[-Ly/2 Ly/2],'k--');
xlabel('$\tau_x (\mathrm{N\,m^{-2}})$','interpreter','LaTex','fontsize',fs);
ylabel('$y (\mathrm{km})$','interpreter','LaTex','fontsize',fs);
set(gca,'xminortick','on','yminortick','on','fontsize',fs,'tickdir','out');
set(gca,'xlim',[min(tau_x(:))-0.05 max(tau_x(:))+0.05],'ylim',[-Ly/2 Ly/2]);
%% Stream function
axes('Position',[i0+length_panel_1+di j0+height_panel_3+dj length_panel_2 height_panel_2])
contourf(xh,yh,h',12,'linestyle','none');
colormap(cmap_br)
hc = colorbar('horiz');
set(hc,'position',[0.7 0.8 0.275 0.02])
hold
hs = streamslice(Xh,Yh,uh,vh);
set(hs,'color','k');
set(gca,'xminortick','on','yminortick','on','tickdir','out','xticklabel',[],'yticklabel',[],'fontsize',fs);
set(gca,'xlim',[0 Lx],'ylim',[-Ly/2 Ly/2]);
text(x_h_label,y_h_label,'$h \mathrm{(m)}$','interpreter','Latex');
axes('Position',[i0+length_panel_1+di j0+0.015 length_panel_2 height_panel_3])
plot(xh,v0,'linewidth',lw);
hold;
plot([0 Lx],[0 0],'k--');
set(gca,'xminortick','on','yminortick','on','fontsize',fs,'tickdir','out');
xlabel('$x (\mathrm{km})$','interpreter','LaTex','fontsize',fs);
set(gca,'xlim',[0 Lx]);
ylabel('$v_0 (\mathrm{m\,s^{-1}})$','interpreter','LaTex','fontsize',fs);
paperwidth = 14; % cm
paperheight = 14; % cm
set(gcf,'PaperUnits','centimeters');
set(gcf,'PaperSize', [paperwidth paperheight]);
set(gcf,'PaperPosition',[0 0 paperwidth paperheight]);
print('-dpng','-r300',[outFname(1:end-4),'.png']);
🎉3 参考文献
部分理论来源于网络,如有侵权请联系删除。
[1]Daniel Bourgault, Cédric Chavanne (2022) SWIM - An instructional numerical model for the westward intensification of the wind-driven ocean circulation


 1759
1759

 被折叠的 条评论
为什么被折叠?
被折叠的 条评论
为什么被折叠?
 到【灌水乐园】发言


