


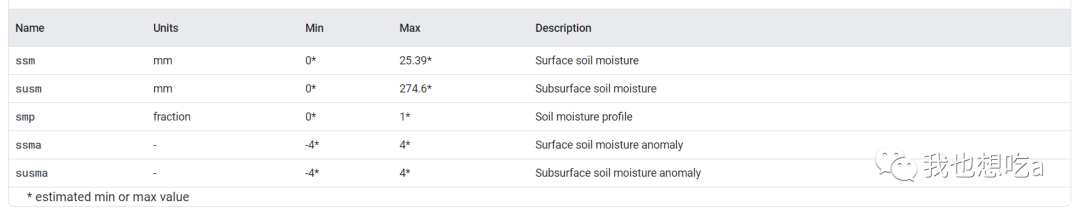
NASA-USDA 增强型 SMAP 全球土壤水分数据以 10 公里的空间分辨率提供全球土壤水分信息。该数据集包括: 地表 和地下 土壤水分 (mm)、 土壤水分剖面(%)、地表和地下土壤水分异常 (-)。
该数据集是通过使用一维集合卡尔曼滤波器 (EnKF) 数据同化方法将卫星衍生的土壤水分主动无源 (SMAP) 3 级土壤水分观测结果集成到修改后的两层 Palmer 模型中生成的。土壤水分异常是根据感兴趣当天的气候学计算的。气候学是根据 SMAP 卫星观测的完整数据记录和以 31 天为中心的移动窗口方法估算的。SMAP 土壤水分观测的同化有助于改进基于模型的土壤水分预测,特别是在世界上缺乏高质量降水数据的仪器设备较差的地区。
该数据集由美国宇航局戈达德太空飞行中心的水文科学实验室与美国农业部外国农业服务部和美国农业部水文与遥感实验室合作开发。
The NASA-USDA Enhanced SMAP Global soil moisture data provides soil moisture information across the globe at 10-km spatial resolution. This dataset includes: surface and subsurface soil moisture (mm), soil moisture profile (%), surface and subsurface soil moisture anomalies (-).
The dataset is generated by integrating satellite-derived Soil Moisture Active Passive (SMAP) Level 3 soil moisture observations into the modified two-layer Palmer model using a 1-D Ensemble Kalman Filter (EnKF) data assimilation approach. Soil moisture anomalies were computed from the climatology of the day of interest. The climatology was estimated based on the full data record of the SMAP satellite observation and the 31-day-centered moving-window approach. The assimilation of the SMAP soil moisture observations help improve the model-based soil moisture predictions particularly over poorly instrumented areas of the world that lack good quality precipitation data.
This dataset was developed by the Hydrological Science Laboratory at NASA's Goddard Space Flight Center in cooperation with USDA Foreign Agricultural Services and USDA Hydrology and Remote Sensing Lab.
Dataset Availability
2015-04-02T12:00:00Z–2022-07-30T12:00:00
Dataset Provider
NASA GSFC
Earth Engine Snippet
ee.ImageCollection("NASA_USDA/HSL/SMAP10KM_soil_moisture")
Bands
示例代码
var dataset = ee.ImageCollection('NASA_USDA/HSL/SMAP10KM_soil_moisture')
.filter(ee.Filter.date('2017-04-01', '2017-04-30'));
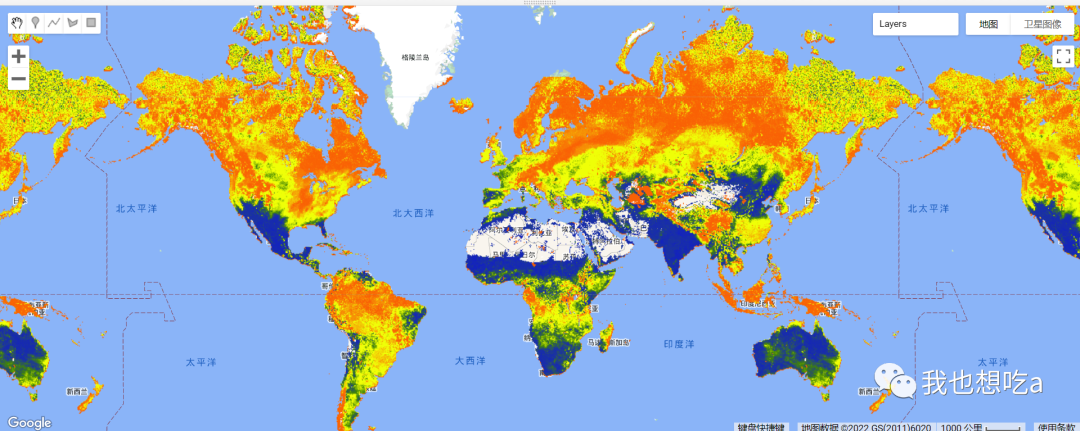
var soilMoisture = dataset.select('ssm');
var soilMoistureVis = {
min: 0.0,
max: 28.0,
palette: ['0300ff', '418504', 'efff07', 'efff07', 'ff0303'],
};
Map.setCenter(-6.746, 46.529, 2);
Map.addLayer(soilMoisture, soilMoistureVis, 'Soil Moisture');展示
土壤湿度指数(SMI)下载代码
//定义研究区
var AOI: Table users/username/boundary_name
//------------SMI-----------------
//从目录中导入土壤水分数据并给出时间段
var soil_moisture = ee.ImageCollection("NASA_USDA/HSL/SMAP10KM_soil_moisture")
.filterDate('yyyy-mm-dd', 'yyyy-mm-dd');
//选择波段, ssm/smp...
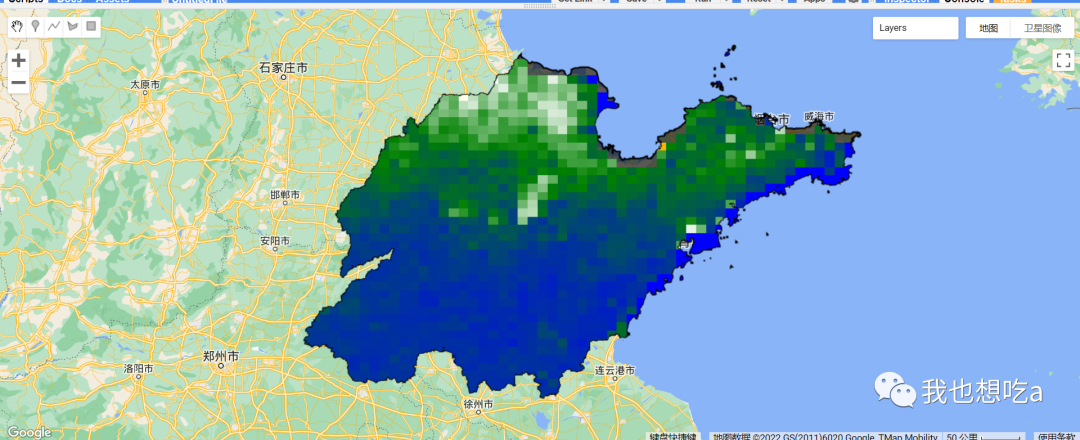
soil_moisture = soil_moisture.select('ssm').mean().clip(AOI)
//可视化参数
var soilMoistureVis = {
min: 0,
max: 25.39,
palette: ['red', 'yellow', 'white', 'green', 'blue'],
}
Map.addLayer(soil_moisture.clip(AOI), soilMoistureVis, 'Soil Moisture');
//get the mean average of raster values to each hexagon polygon
var Zonal_SMI = soil_moisture.reduceRegions(AOI, ee.Reducer.mean(), 90)
Export.table.toDrive({
collection: Zonal_SMI,
description:'SMI',
fileFormat: 'GeoJSON'
});
/*
//option for more than 20000 local boundary polygons; create a polygon around the area
// Export the image, specifying scale and region.
Export.image.toDrive({
image: soil_moisture.clip(AOI),
description: 'soilmoisture',
scale: 90,
maxPixels: 1e10,
region: AOI
});
*/展示


 956
956

 被折叠的 条评论
为什么被折叠?
被折叠的 条评论
为什么被折叠?
 到【灌水乐园】发言


