


本质:修改颜色栏
帮助文档:
colormap函数
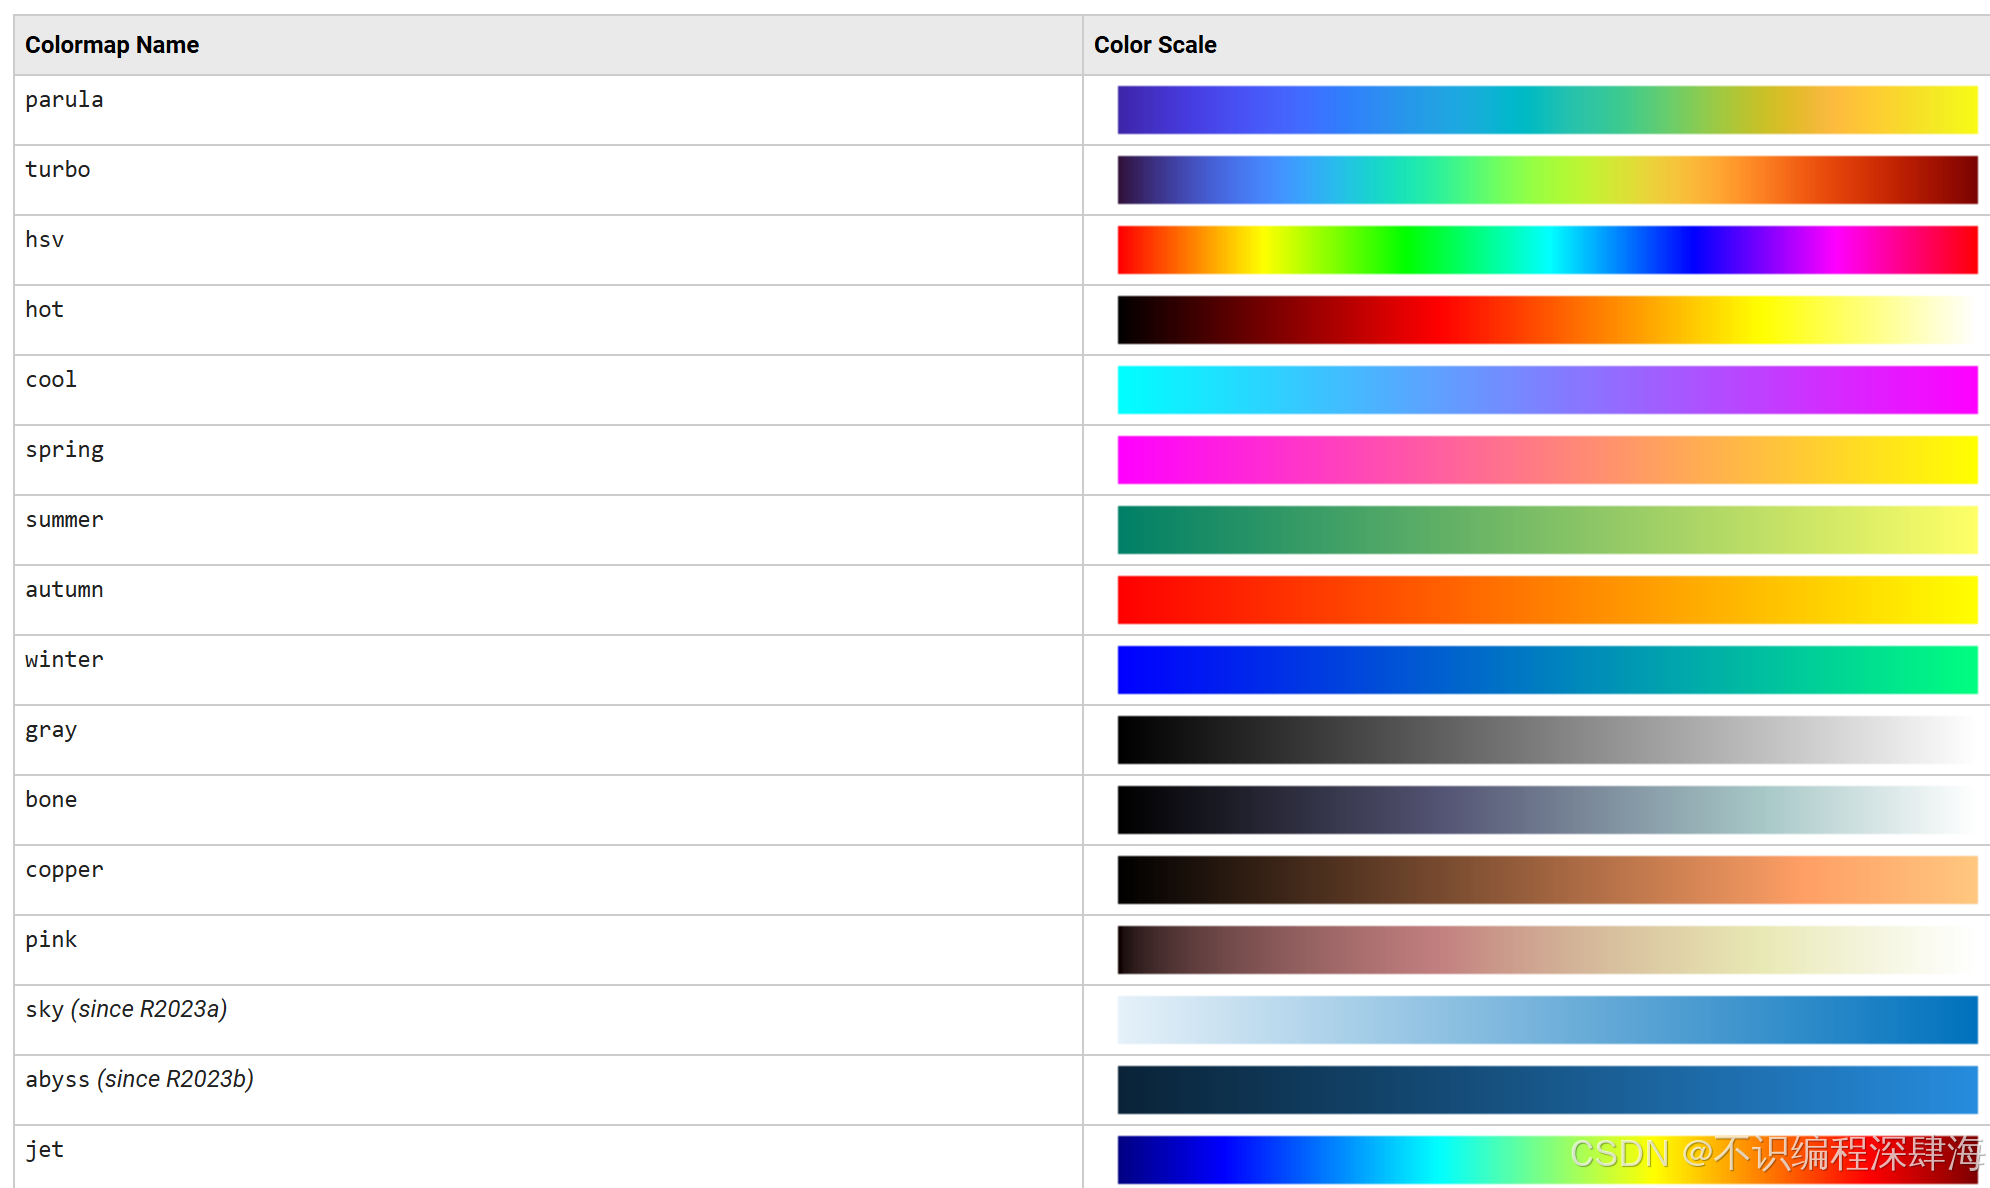
colormap map将当前图窗的颜色图设置为指定的预定义颜色图,可以设置的方案如下:
 例子
例子
x=linspace(0,2*pi,200);
y=sin(x)+rand(1,200);
close all;figure
scatter(x,y,[],y,'filled')
colorbar
colormap cool
颜色图的本质:
一个n行3列的矩阵,矩阵的每一行代表一个颜色,每个颜色由RGB三个分量表示。
直接运行colormap可以返回当前图窗的颜色图,形式为RGB三元组组成的三列矩阵。
dd=colormap从2019版本颜色图默认有256种颜色。
配色方案的形成
x=linspace(0,2*pi,200);
y=sin(x)+rand(1,200);
close all;figure
scatter(x,y,[],y,'filled')
colorbar
mymap=[0 0 0;1,0,0;0,1,0;0,0,1;1,0,1]  %形成自己的配色方案
colormap(mymap)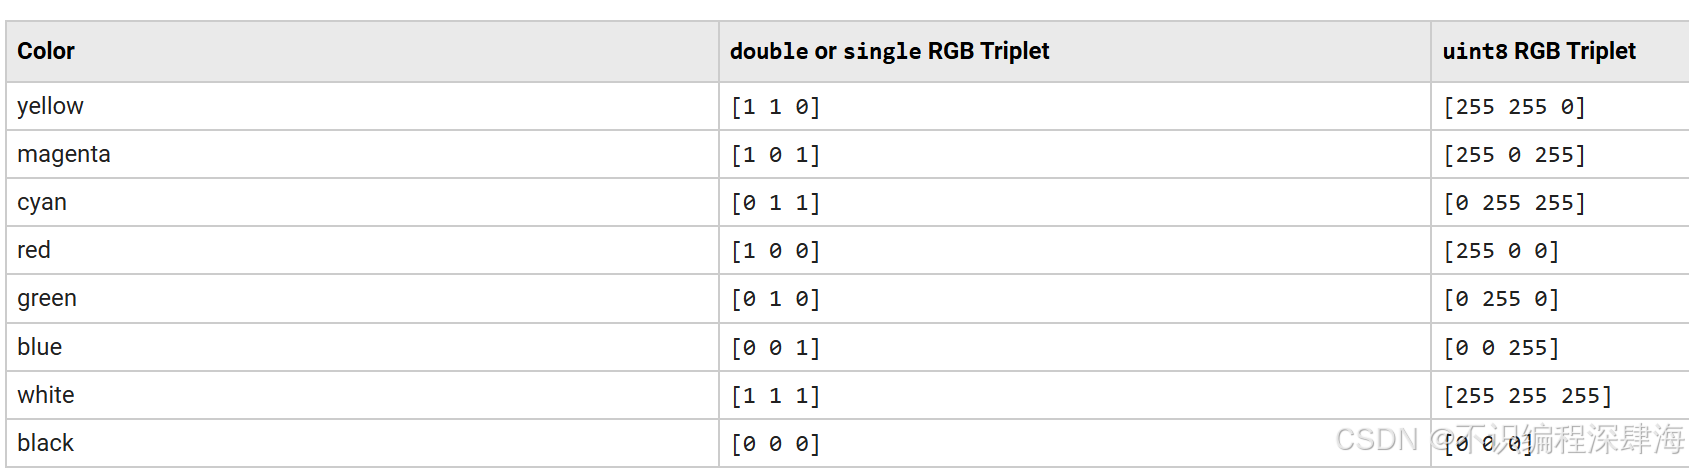
注意:在使用plot函数绘制线图时,线图的颜色不能通过colormap自动调整!!
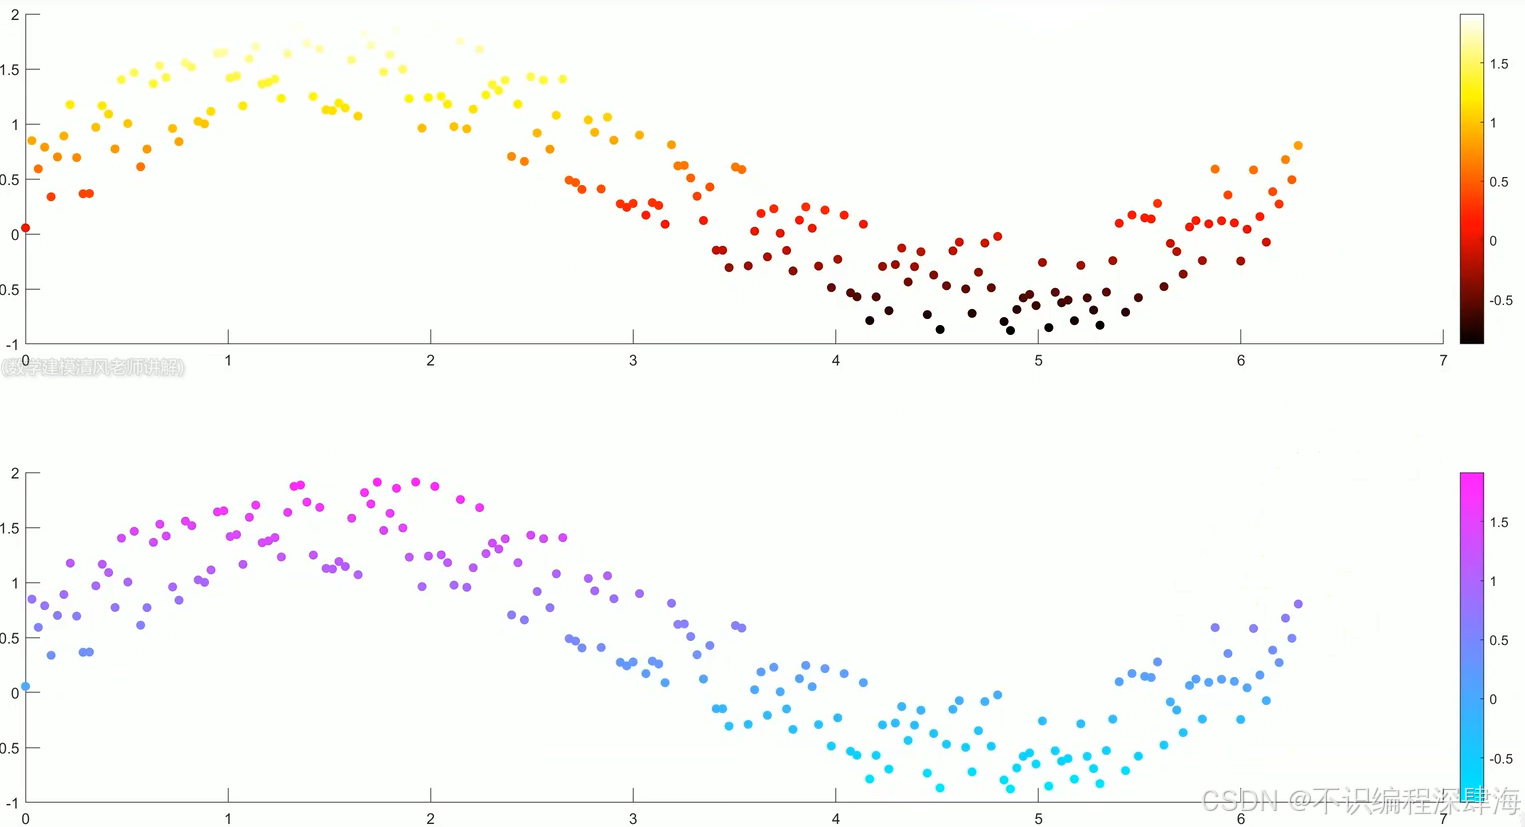
一个特殊的用法:为不同的坐标区设置不同的颜色图
colormap(target,map)为target指定的图窗、坐标区或独立可视化设置颜色图,而不是为当前图窗设置颜色图。
同一个图窗,不同的坐标区,指定不同的配色方案。
x=linspace(0,2*pi,200);
y=sin(x)+rand(1,100);
close all;figure
ax1 = subplot(2,1,1);
scatter(x,y,[],y,'filled')
colormap(ax1,'hot')
colorbar
ax2=subplot(2,1,2);
scatter(x,y,[],y,'filled')
colormap(ax2,'cool')
colorbar
---------------------------本节内容学习与2整理来自bilibili:清风教你学编程-----------------------------------


 11万+
11万+

 被折叠的 条评论
为什么被折叠?
被折叠的 条评论
为什么被折叠?
 到【灌水乐园】发言


