高德地图轨迹回放(以及点位信息数据处理和展示)

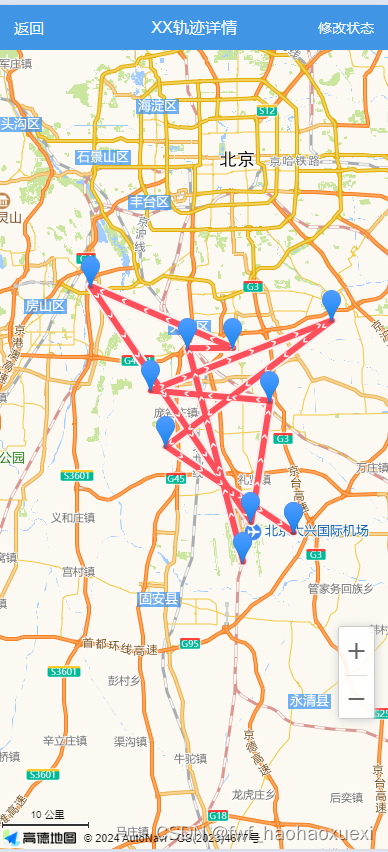
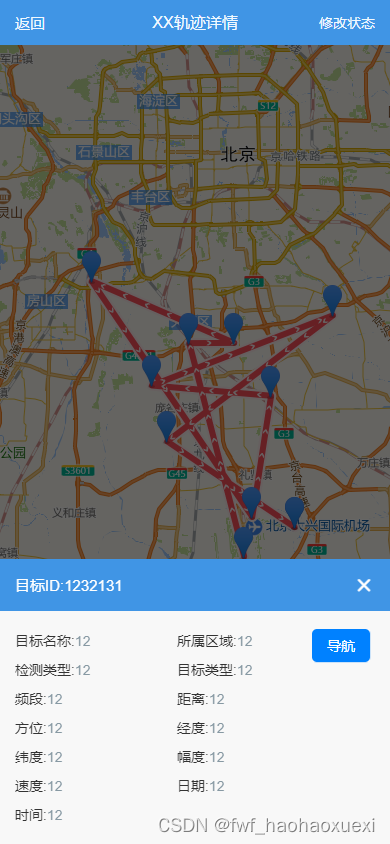
实际业务中常常会有轨迹回放的场景实现,以下是实现轨迹回放以及点位信息展示处理等场景,先上图看是否满足你的需求(满足的话麻烦点赞收藏!轨迹数据随机模拟的 可根据实际场景接口来查)

一,初始化地图 

       记得先申请你的高德地图的key(申请对应平台的key)

 //初始化地图
    initAmap() {
      this.map = new AMap.Map("container", {
        resizeEnable: true,
        center: [116.397155, 39.916345],
        zoom: 12,
      });
      AMap.plugin(["AMap.ToolBar", "AMap.Scale"]);
      //添加工具条控件,工具条控件集成了缩放、平移、定位等功能按钮在内的组合控件
      this.map.addControl(new AMap.ToolBar());

      //添加比例尺控件,展示地图在当前层级和纬度下的比例尺
      this.map.addControl(new AMap.Scale());
      this.manyPersonWays();
    },

二,数据模拟(这里可以根据实际场景来获取数据)

我这里的是一秒随机生成一个点位经纬度然后去更新 也是写在 manyPersonWays里面

  const _this = this;
      // 北京主城区的经纬度范围
      const minLatitude = 39.442; // 最小纬度
      const maxLatitude = 39.864; // 最大纬度
      const minLongitude = 116.172; // 最小经度
      const maxLongitude = 116.553; // 最大经度
      // 定义生成标记点
      const numMarkers = [
        {
          id: 1,
          url: "../static/avatar_girl.png", // 图标的URL地址
        },
      ];
      // 定义更新标记点位置的时间间隔(毫秒)
      const updateInterval = 1000;
      // 生成标记点
      const markers = [];
      for (let i = 0; i < numMarkers.length; i++) {
        // 随机生成初始经纬度
        const latitude =
          Math.random() * (maxLatitude - minLatitude) + minLatitude;
        const longitude =
          Math.random() * (maxLongitude - minLongitude) + minLongitude;
        const marker = new AMap.Marker({
          id: numMarkers[i].id,
          position: [latitude, longitude],
          offset: new AMap.Pixel(-10, -30),
          map: _this.map,
        });

        // 将标记点添加到数组中
        markers.push(marker);
      }

三,创建每一个路过的经纬度的marker 再添加点击事件进行信息处理

          绘制行驶路径,点击事件获取到之后可以进行自定义的处理(可以写弹窗点击事件可获取当前点位数据信息 进行展示等操作)

  // 定时器更新标记点位置
      const updateMarkerPositions = setInterval(() => {
        // 模拟更新标记点位置 轨迹回放可以使用此方法
        // 创建标记点对象
        function createMarker(longitude, latitude) {
          const marker = new AMap.Marker({
            position: [longitude, latitude],
            // icon: numMarkers[i].url,
            offset: new AMap.Pixel(-10, -30),
            map: _this.map,
            // iconSize: new AMap.Size(30, 30),
          });
          return marker;
        }
        // 绘制行驶路径
        function drawPath(path) {
          _this.path.push(path);
          // 将路径添加到对应标记点的路径数组中
          // 创建 Polyline 对象
          var index = 5;
          // 遍历标记点数组,更新每个标记点的位置
          // 创建 Polyline 对象
          var routeLine = new AMap.Polyline({
            path: _this.path, // 将所有路径数组拼接为一个路径数组
            showDir: true,
            isOutline: true,
            outlineColor: "#ffeeee",
            borderWeight: 2,
            strokeColor: "#fd3e4a", // 使用不同的深色区分不同的轨迹
            strokeWeight: 6,
            lineJoin: "round",
            lineCap: "round",
          });
          index++;
          // 将 Polyline 对象添加到地图上
          _this.map.add(routeLine);
        }
        // 添加标记点,并开始绘制行驶路径
        function addMarkerAndDrawPath(position) {
          console.log(position, "position");
          drawPath([position.lng, position.lat]);
          // 创建新的标记点
          const marker = createMarker(position.lng, position.lat);
          // 添加地图点击事件监听器
          _this.map.on("click", function (e) {
            console.log("Map clicked!");
          });

          // 添加标记点点击事件监听器
          marker.on("click", function (e) {
            _this.modalName = "bottomModal";
            console.log("Marker clicked!", e);
          });
          _this.map.add(marker);
          // 将标记点位置添加到路径中
        }
        // 存储每个标记点的路径
        markers.forEach((marker) => {
          // 随机生成新的经纬度
          const newLatitude =
            Math.random() * (maxLatitude - minLatitude) + minLatitude;
          const newLongitude =
            Math.random() * (maxLongitude - minLongitude) + minLongitude;
          // 更新标记点位置
          marker.setPosition([newLongitude, newLatitude]);
          // 获取标记点的经纬度
          const position = marker.getPosition();
          // 绘制该标记点的路径
          // drawPath(position);
          addMarkerAndDrawPath(position);
        });
      }, updateInterval);

      // 模拟一段时间后停止更新(这里使用伪代码代替)
      setTimeout(() => {
        clearInterval(updateMarkerPositions);
        console.log("更新已停止");
        // 示例:更新已停止,移除对应标记点和路径
        // _this.map.remove(
        //   _this.map.getAllOverlays("marker")[
        //     _this.map.getAllOverlays("marker").length - 1
        //   ]
        // );
      }, 10000); // 模拟更新持续5秒钟

  • 7
    点赞
  • 5
    收藏
    觉得还不错? 一键收藏
  • 0
    评论
对于Vue 3和高德地图轨迹回放,你可以按照以下步骤进行操作: 1. 首先,确保你已经安装了Vue 3和高德地图的相关依赖。你可以使用npm或yarn来安装这些依赖。例如,在你的Vue项目中,可以运行以下命令来安装高德地图的依赖: ``` npm install vue-amap ``` 2. 在你的Vue组件中,引入Vue AMap库并注册该组件: ```javascript import VueAMap from 'vue-amap'; export default { ... mounted() { Vue.use(VueAMap); VueAMap.initAMapApiLoader({ key: 'your_amap_key', plugin: ['AMap.Polyline'] }); }, ... } ``` 在上述代码中,你需要将`your_amap_key`替换成你自己的高德地图API密钥。 3. 在模板中添加地图容器和控件: ```html <template> <div> <amap :zoom="13" :center="[lng, lat]"> <amap-polyline :path="path" :visible="true" :style="{ strokeColor: 'red', strokeWeight: 6 }"></amap-polyline> </amap> </div> </template> ``` 在上述代码中,`amap`是地图容器组件,`amap-polyline`是轨迹回放的折线组件。你可以根据需要调整地图的缩放级别和中心点位置,以及折线的样式。 4. 在组件的`data`属性中定义轨迹回放的经纬度数据: ```javascript data() { return { lng: 116.397428, lat: 39.90923, path: [ [116.405289, 39.904987], [116.406089, 39.904987], [116.406289, 39.905087], // 更多经纬度数据... ] }; } ``` 你需要根据实际情况提供正确的经纬度数据。 5. 最后,你可以根据需求实现轨迹回放的逻辑。例如,你可以使用定时器来逐步显示折线上的点,实现轨迹的动态回放效果。 这样,你就可以在Vue 3中使用高德地图实现轨迹回放了。记得根据你的实际需求进行相应的调整和扩展。希望这能帮到你!

“相关推荐”对你有帮助么?

  • 非常没帮助
  • 没帮助
  • 一般
  • 有帮助
  • 非常有帮助
提交
评论
添加红包

请填写红包祝福语或标题

红包个数最小为10个

红包金额最低5元

当前余额3.43前往充值 >
需支付:10.00
成就一亿技术人!
领取后你会自动成为博主和红包主的粉丝 规则
hope_wisdom
发出的红包
实付
使用余额支付
点击重新获取
扫码支付
钱包余额 0

抵扣说明:

1.余额是钱包充值的虚拟货币,按照1:1的比例进行支付金额的抵扣。
2.余额无法直接购买下载,可以购买VIP、付费专栏及课程。

余额充值