


学习李沐《动手学深度学习》笔记。
代码
import torch
from torch.distributions import multinomial
import matplotlib.pyplot as plt
# from d2l import torch as d2l

probs=torch.ones([6])/6

multinomial.Multinomial(5,probs).sample()

counts=multinomial.Multinomial(10,probs).sample((500,))

cum_counts=counts.cumsum(dim=0)
cum_counts

estimates=cum_counts/cum_counts.sum(dim=1,keepdims=True)
estimates

plt.figure(figsize=(6,4.5))
for i in range(6):
  plt.plot(estimates[:, i].numpy(),
  label=("P(die=" + str(i + 1) + ")"))
plt.axhline(y=0.167, color='black', linestyle='dashed')
plt.gca().set_xlabel('Groups of experiments')
plt.gca().set_ylabel('Estimated probability')
plt.legend() #对应label
代码解析
代码的输出在代码块里面,引号注释起来了。
import torch
from torch.distributions import multinomial
import matplotlib.pyplot as plt
# from d2l import torch as d2l使用原代码会报错module 'torch' has no attribute 'SymInt',有文章说是d2l中的torch.py文件和其他文件重名,不知道怎么解决,索性不使用这个包了。
probs=torch.ones([6])/6
multinomial.Multinomial(5,probs).sample()
#tensor([0., 2., 0., 1., 2., 0.])
multinomial.Multinomial(5, probs)创建一个多项式分布对象,该对象可以模拟投掷5次骰子的实验。
生成一个1行6列的全1向量(张量),再除以6。然后随机抽到某列,某列数值加1,连续进行5次。
counts=multinomial.Multinomial(10,probs).sample((500,))
counts
cum_counts=counts.cumsum(dim=0)
cum_counts
'''
tensor([[0., 3., 2., 1., 2., 2.],
[0., 1., 4., 2., 2., 1.],
[0., 1., 0., 6., 0., 3.],
...,
[2., 1., 2., 2., 1., 2.],
[1., 2., 2., 1., 2., 2.],
[1., 2., 2., 3., 0., 2.]])
tensor([[ 0., 3., 2., 1., 2., 2.],
[ 0., 4., 6., 3., 4., 3.],
[ 0., 5., 6., 9., 4., 6.],
...,
[828., 802., 817., 869., 843., 821.],
[829., 804., 819., 870., 845., 823.],
[830., 806., 821., 873., 845., 825.]])
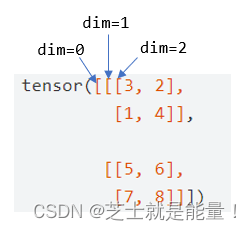
'''进行500组实验,每组随机抽1次。然后每行按列相加。cumsum函数:返回沿给定轴的元素的累积和。给定轴如下图。
estimates=cum_counts/cum_counts.sum(dim=1,keepdims=True)
estimates

'''
tensor([[0.0000, 0.3000, 0.2000, 0.1000, 0.2000, 0.2000],
        [0.0000, 0.2000, 0.3000, 0.1500, 0.2000, 0.1500],
        [0.0000, 0.1667, 0.2000, 0.3000, 0.1333, 0.2000],
        ...,
        [0.1663, 0.1610, 0.1641, 0.1745, 0.1693, 0.1649],
        [0.1661, 0.1611, 0.1641, 0.1743, 0.1693, 0.1649],
        [0.1660, 0.1612, 0.1642, 0.1746, 0.1690, 0.1650]])
'''
每行除以每行的总和,求得概率。
plt.figure(figsize=(6,4.5))
for i in range(6):
  plt.plot(estimates[:, i].numpy(),
  label=("P(die=" + str(i + 1) + ")"))
plt.axhline(y=0.167, color='black', linestyle='dashed')
plt.gca().set_xlabel('Groups of experiments')
plt.gca().set_ylabel('Estimated probability')
plt.legend() #对应label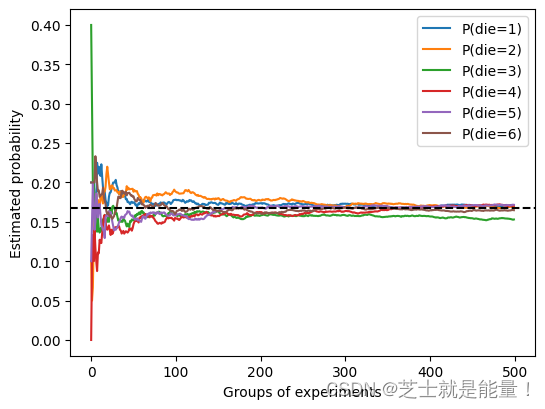


 408
408


 被折叠的 条评论
为什么被折叠?
被折叠的 条评论
为什么被折叠?
 到【灌水乐园】发言


