


 本文介绍了一种名为PHATE的高维生物数据可视化工具,它在保持局部和全局非线性结构方面表现出色,尤其在处理噪声和复杂模式时优于其他方法。PHATE通过信息几何距离和扩散映射算法提供低维度且去噪的嵌入,适用于单细胞RNA测序等多种类型的数据。作者强调理解和原理的重要性,而非简单复制代码。
目前单细胞数据做降维分析的方法有很多(PCA,TSNE,UMAP),大家不用一个一个的去试,掌握一些主要的分析软件,深入理解其中的原理和代码,实现软件之间的有优势互补,达到我们的分析目的。
今天给大家分享一个方法,文献在Visualizing structure and transitions in high-dimensional biological data,影响因子36分多,相当高了。今天我们的任务就是来参透文章及分享代码,大家一定要认真学习,掌握精髓,而不是简单的copy 代码。
文章部分:
一、摘要:
The high-dimensional data created by high-throughput technologies require visualization tools that reveal data structure and patterns in an intuitive form. We present PHATE, a visualization method that captures both local and global nonlinear structure using an information-geometric distance between data points. We compare PHATE to other tools on a variety of artificial and biological datasets, and find that it consistently preserves a range of patterns in data, including continual progressions, branches and clusters, better than other tools. We define a manifold preservation metric, which we call denoised embedding manifold preservation (DEMaP), and show that PHATE produces lower-dimensional embeddings that are quantitatively better denoised as compared to existing visualization methods. An analysis of a newly generated single-cell RNA sequencing dataset on human germ-layer differentiation demonstrates how PHATE reveals unique biological insight into the main developmental branches, including identification of three previously undescribed subpopulations. We also show that PHATE is applicable to a wide variety of data types, including mass cytometry, single-cell RNA sequencing, Hi-C and gut microbiome data.(这部分没什么意思,夸自己的软件呗)
二、简介
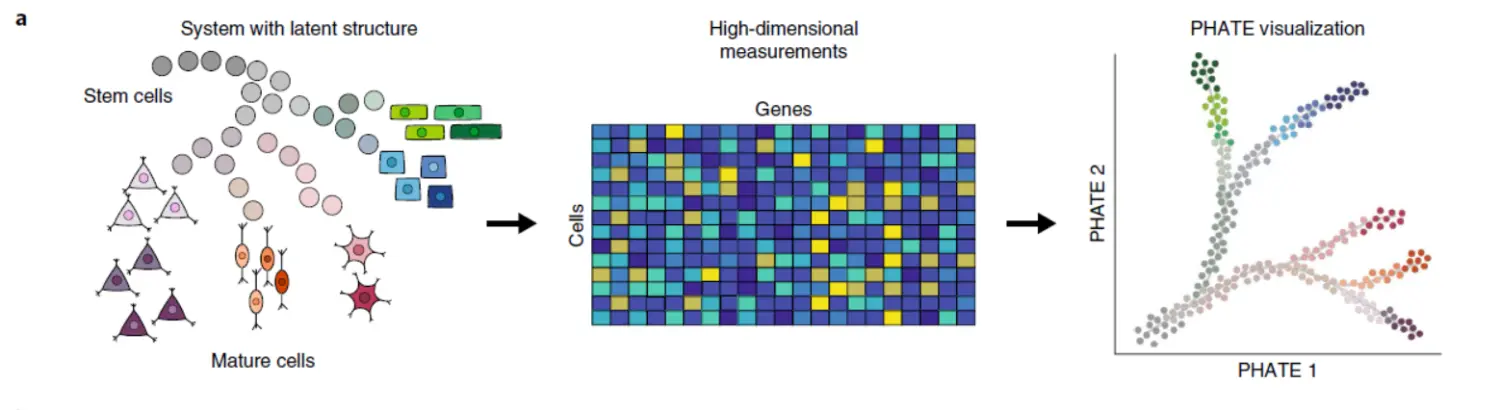
首先单细胞数据确实需要非常好的可视化软件,目前存在的可视化软件包括principalcomponent analysis (PCA)、 t-distributed stochastic neighbor embedding (t-SNE)and Uniform Manifold Approximation and Projection (UMAP),其实大家现在用的最多的应该就是UMAP,然而,these methods are suboptimal for exploring high-dimensional biological data.至于原因:
(1)such methods tend to be sensitive to noise.(这个地方不知道大家研究过没,单细胞数据的降噪和droplet的分析),methods like PCA and Isomap fail to explicitly remove this noise for visualization, rendering fine-grained local structure impossible to recognize.(这个地方需要注意,PCA确实有这个问题)
(2)nonlinear visualization methods such as t-SNE often scramble the global structure in data(全局结构不够精确,所以现在更多的用UMAP)。
(3)many dimensionality-reduction methods (for example, PCA and diffusion maps) fail to optimize for two-dimensional (2D) visualization as they are not specifically designed for visualization.(听过我的课程的同学是不是很熟悉!!😄)
(4)common implementations of dimensionality reduction methods often lack computational scalability。(扩展性差),State-of-the-art methods such as multidimensional scaling (MDS) and t-SNE were originally presented as proofs-of-concept with somewhat naive implementations, which do not scale well to datasets with hundreds of thousands, let alone millions, of data points owing to speed or memory constraints.(这个地方不知道大家有没有研究过,再次强调,不要只是照抄代码,做一个理性的人)。
(5)some methods try to alleviate visualization challenges by directly imposing a fixed geometry or intrinsic structure on the data.However, methods that impose a structure
on the data generally have no way of alerting the user whether the structural assumption is correct.(这个地方许多新的软件已经修正了)。作者举了例子,any data will be transformed to fit a tree with Monocle212 or clusters with t-SNE. While such methods are useful for data that fit their prior assumptions, they can generate misleading results otherwise, and are often ill suited for hypothesis generation or data exploration(这个地方大家很熟悉吧,为什么聚类和monocle2的结果总是不尽如人意,明白了吧!!)
接下来就是PHATE软件的优势了,我们略过。。。。。。
provides an accurate, denoised representation of both local and global structure of a dataset in the required number of dimensions without imposing any strong assumptions on the structure of the data, and is highly scalable both in memory and runtime.
三、Result
我们现在看一些基础的知识
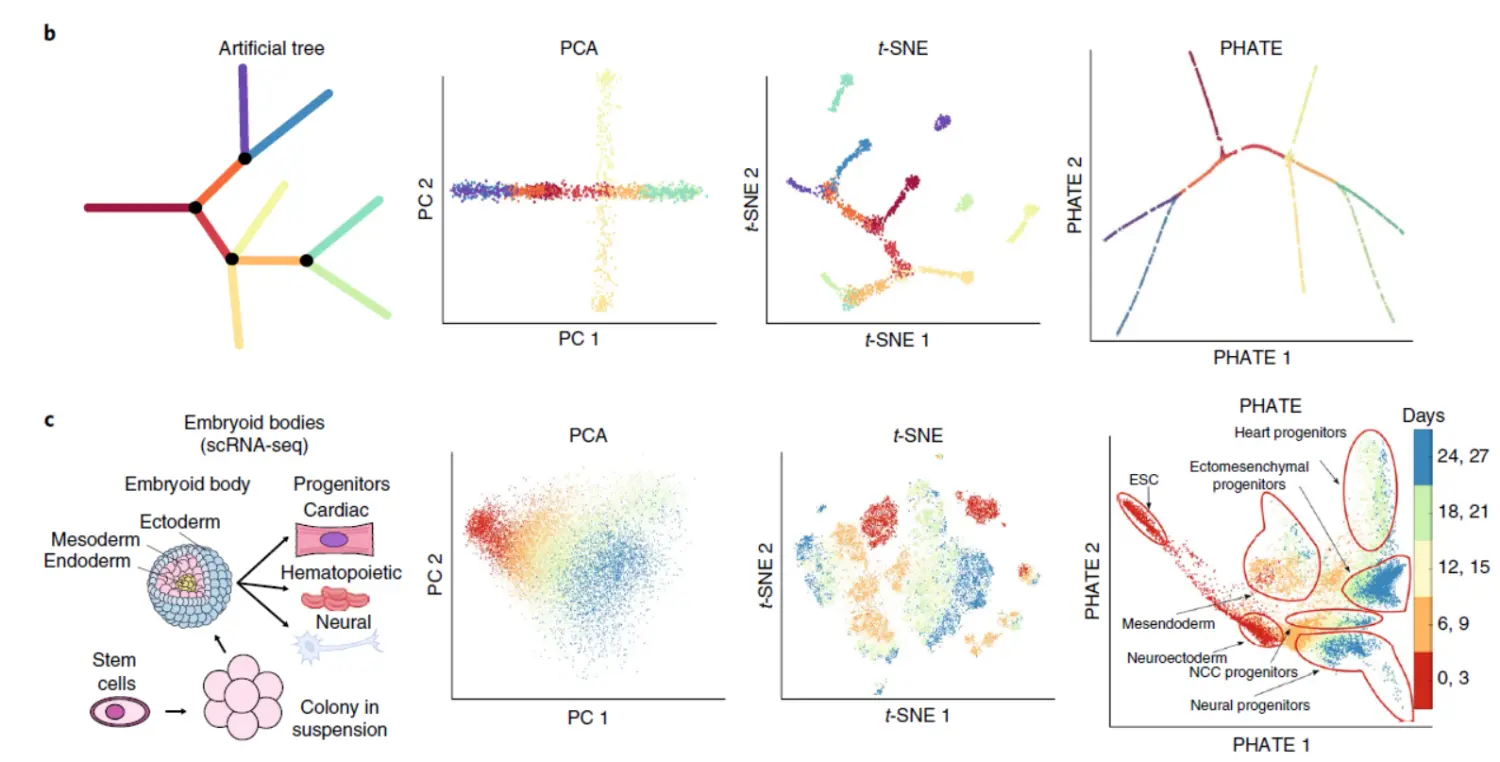
(1)t-SNE focuses on preserving local structure, often at the expense of the global structure
(2)PCA focuses on preserving global structure at the expense of the local structure
(3)Although PCA is often used for denoising as a preprocessing step, both PCA and t-SNE provide noisy visualizations when the data is noisy, which can obscure the structure of the data(这个地方大家一定找掌握,不然分析数据完了也不知道对还是错)。
(4)By contrast, diffusion maps effectively denoise data and learn the local and global structure.However, diffusion maps typically encode this information in higher dimensions, which are not amenable to visualization, and can introduce distortions in the visualization under certain conditions(diffusion maps的方法,之前的课程讲过的)。
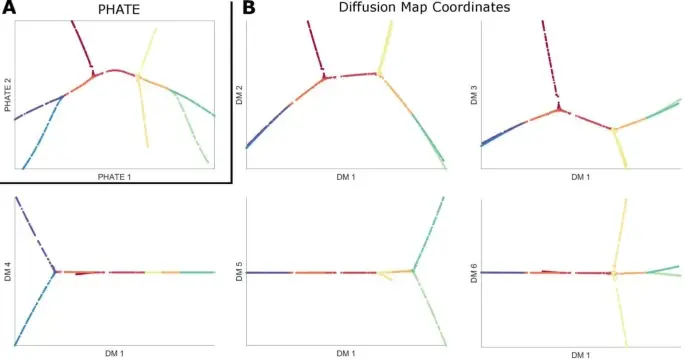
重点来了,PHATE is designed to overcome these weaknesses and provide a visualization that preserves the local and global structure of the data, denoises the data and presents as much information as possible into low dimensions.
我们来看一下主要的步骤:
(1)Encode local data information via local similarities (局部结构),这里使用的距离仍然是欧氏距离(R语言里面对于距离的定义我课上讲过,基础大家一定要知道)。
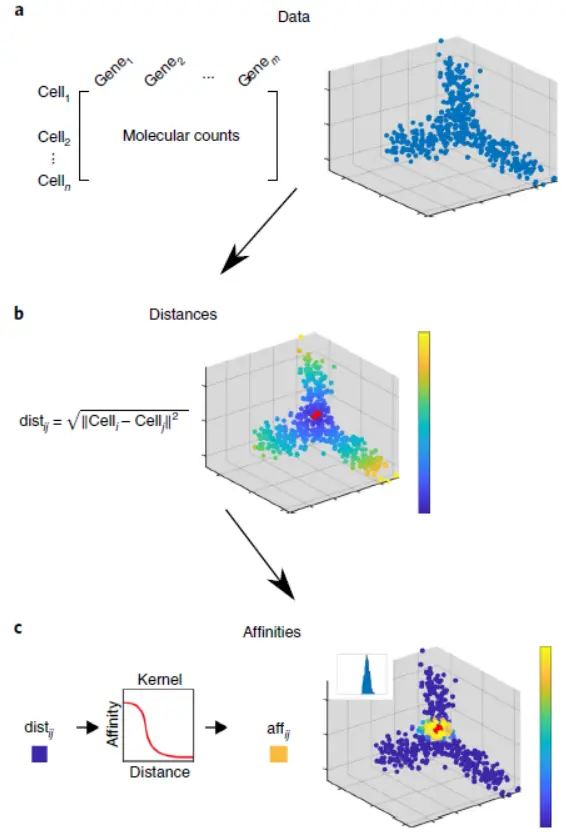
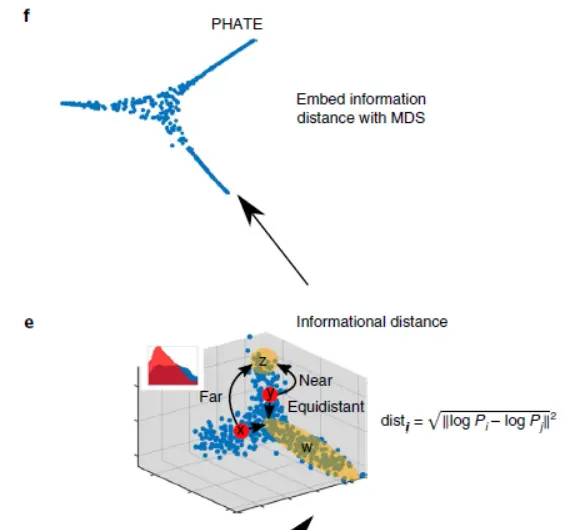
(2)Encode global relationships in data using the potential distance。这里用到的就是diffusion map的算法,这个课上我也讲过。
(3)Embed potential distance information into low dimensions for visualization.(低维可视化)this ensures that all variability is squeezed into two dimensions for a maximally informative embedding
文献推荐的分析策略
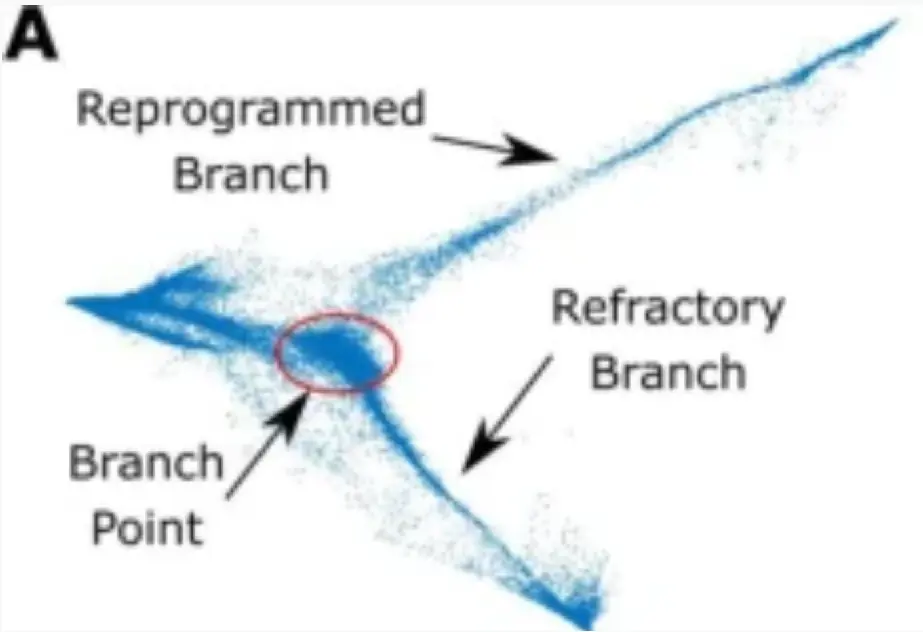
Here we present new methods that provide suggested end points, branch points and branches on the basis of the information from higher-dimensional PHATE embeddings(数据结构的分析,大家其实可以看得出来,结构与monocle2树形结构差不多)。
(1)Branch-point identification with local intrinsic dimensionality。大家看一下下图对于branch points的定义。branch points often encapsulate switch-like decisions where cells sharply veer towards one of a small number of fates。
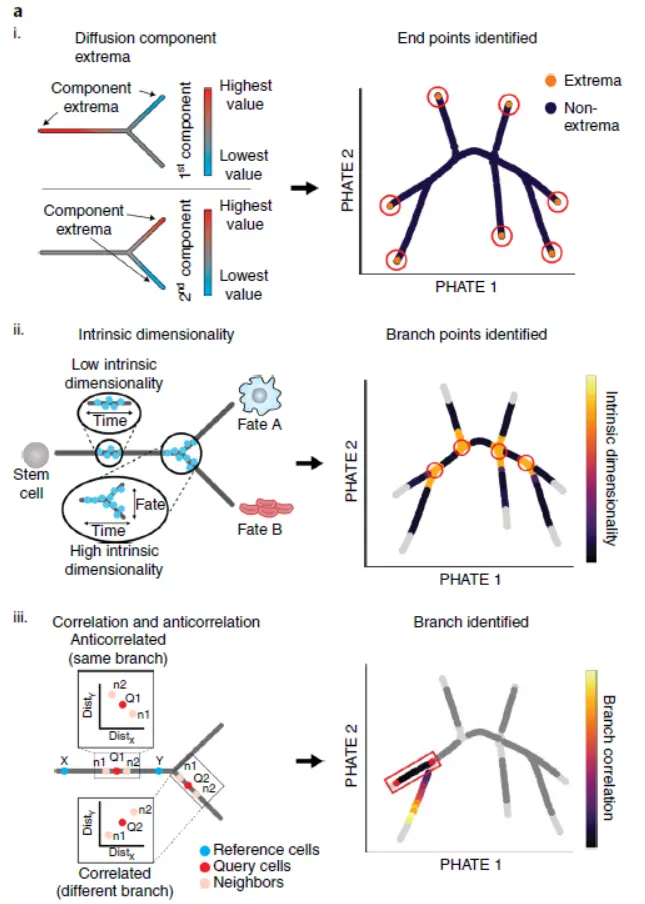
(2)End-point identification with diffusion extrema.(这个软件居然还要识别end points,跟URD有一拼。)We identify end points in the PHATE embedding as those that are least central and most distinct by computing the eigenvector centrality and the distinctness of a cellular state relative to the general data by considering the minima and maxima of diffusion eigenvectors as motivated by ref.这个地方有兴趣可以好好研究一下, branch point和end spoint的识别,以及填充细胞到轨迹上,对先验知识要求很高,当然也就意味着更为准确。我们看一下填充的效果
跟力导向布局差不多。
软件之间的比较。
这部分我们简单看一下就可以了。
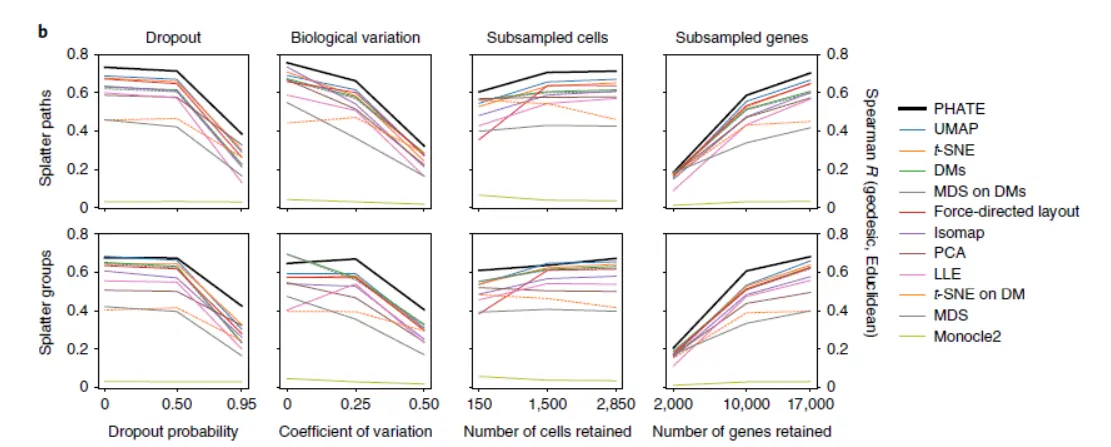
看一下结果,当然,PHATE的准确度高,这个从理论上讲试必然的,因为PHATE对于人为的监督要求更高。PHATE had the highest DEMaP score in 22 of 24 comparisons and was the top-performing method overall。Uniform manifold approximation and projection (UMAP) was the second best performing method overall but had the highest DEMaP score in only two of the comparisons, one of which is equal with PHATE.(UMAP的优势)。
不同方法之间的降维可视化比较
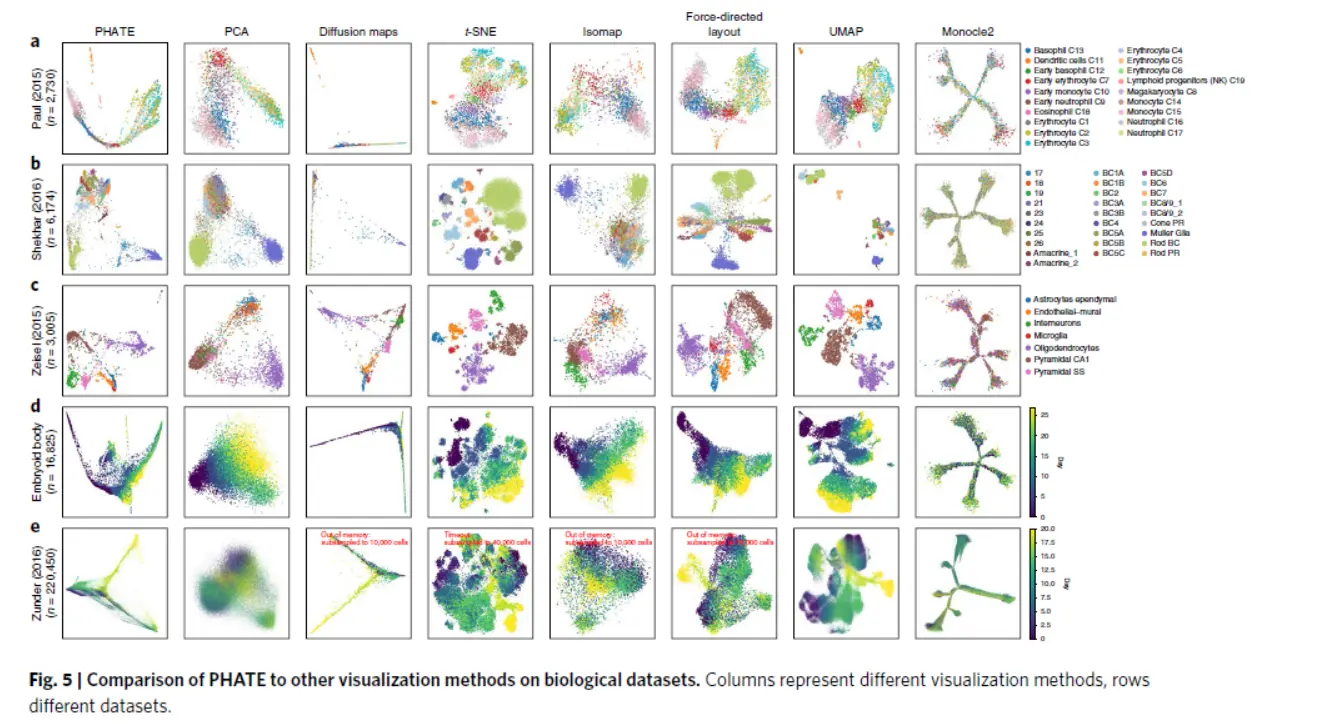
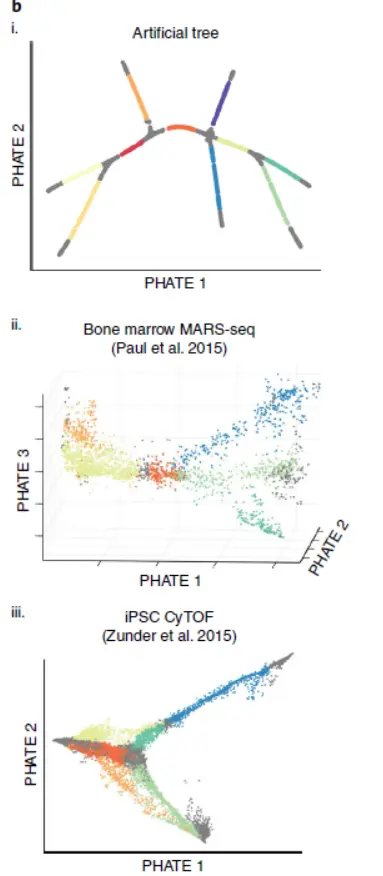
PHATE provides a clean and relatively denoised visualization of the data that highlights both the local and global structure。当然,后面还有一些数据分析的结果,这都是套路了,大家看一下就可以。
其实我们这里总结一句,PHATE解决的问题就是,降维可视化的结果与细胞本身的内在联系相互对应,PHATE方法最好,UMAP次之。
接下来,我们看一下代码:
加载模块
import matplotlib.pyplot as plt
import pandas as pd
import numpy as np
import phate
import scprep
import sklearn.decomposition # PCA
import sklearn.manifold # t-SNE
import umap
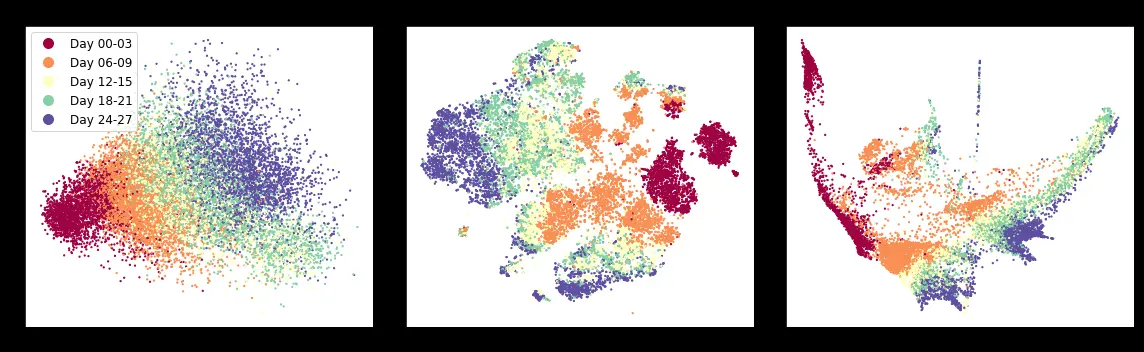
至于读取数据,质控之类的我们这里就不分享了,就看PHATE降维可视化,
phate_operator.set_params(knn=4, decay=15, t=12)
Y_phate = phate_operator.fit_transform(EBT_counts)
这个地方我们来关注一下参数问题:
    knn : Number of nearest neighbors (default: 5). Increase this (e.g. to 20) if your PHATE embedding appears very disconnected. You should also consider increasing knn if your dataset is extremely large (e.g. >100k cells)
    decay : Alpha decay (default: 15). Decreasing decay increases connectivity on the graph, increasing decay decreases connectivity. This rarely needs to be tuned. Set it to None for a k-nearest neighbors kernel.
    t : Number of times to power the operator (default: 'auto'). This is equivalent to the amount of smoothing done to the data. It is chosen automatically by default, but you can increase it if your embedding lacks structure, or decrease it if the structure looks too compact.
    gamma : Informational distance constant (default: 1). gamma=1 gives the PHATE log potential, but other informational distances can be interesting. If most of the points seem concentrated in one section of the plot, you can try gamma=0.
如果真如文章所说,PHATE有能力learn and maintain local and global distances in low dimensional space,那么这个可视化的结果,高于UMAP,是最合适的。


 1520
1520

 被折叠的 条评论
为什么被折叠?
被折叠的 条评论
为什么被折叠?
 到【灌水乐园】发言


