


💥💥💞💞欢迎来到本博客❤️❤️💥💥
🏆博主优势:🌞🌞🌞博客内容尽量做到思维缜密,逻辑清晰,为了方便读者。
⛳️座右铭:行百里者,半于九十。
📋📋📋本文目录如下:🎁🎁🎁
目录

💥1 概述
通过最小化目标函数的聚类算法有一个明显的缺点,即必须手动设置聚类数。虽然密度峰值聚类能够找到聚类的数量,但在用于图像分割时会出现内存溢出,因为中等大小的图像通常包含大量像素,从而导致巨大的相似性矩阵。为了解决这个问题,我们提出了一种用于图像分割的自动模糊聚类框架(AFCF)。拟议的框架有三方面的贡献。首先,将超像素思想用于密度峰值(DP)算法,有效减小相似矩阵的大小,从而提高DP算法的计算效率;其次,我们采用密度平衡算法来获得鲁棒决策图,帮助DP算法实现全自动聚类。最后,在框架中使用基于先验熵的模糊c均值聚类来改善图像分割结果。由于考虑了像素和隶属关系的空间邻域信息,有效地改善了最终的分割结果。实验表明,所提框架不仅实现了图像自动分割,而且比现有算法提供了更好的分割结果。
文献来源:
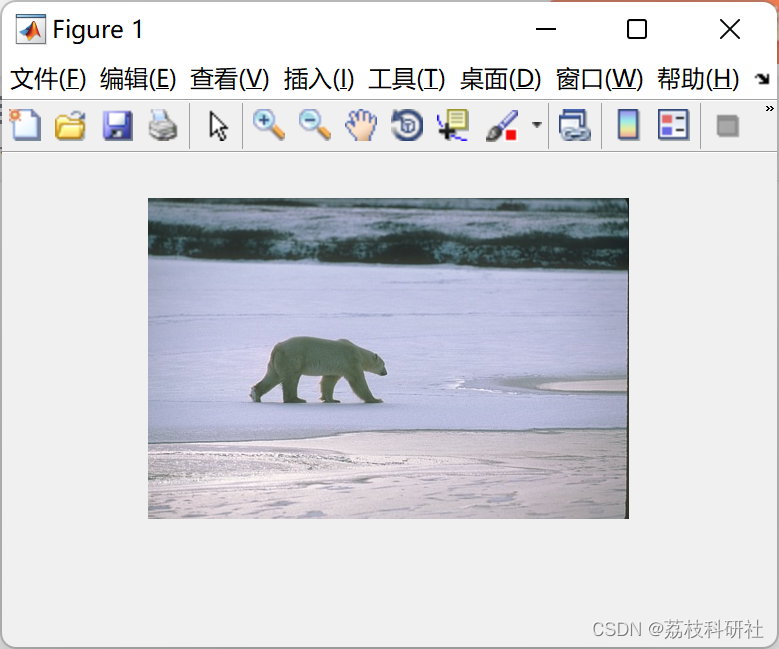
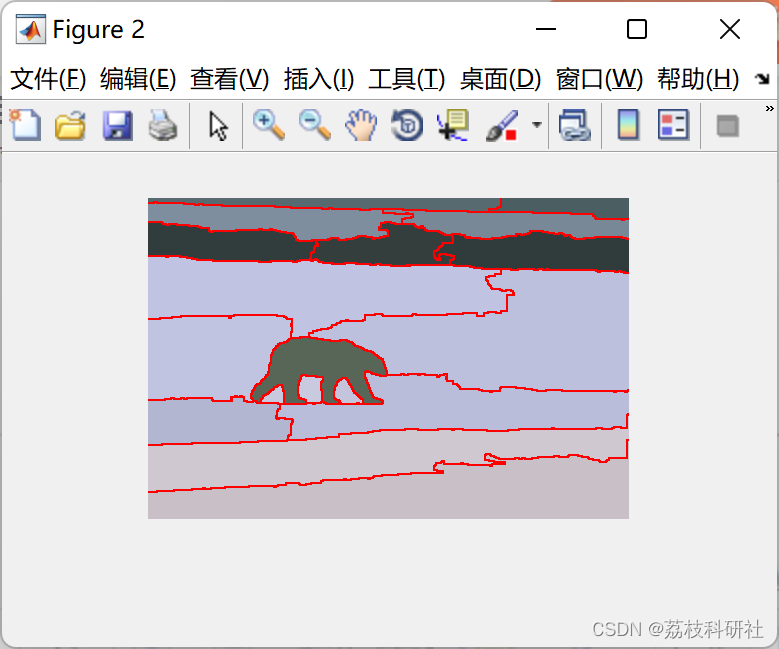
📚2 运行结果


部分代码:
clc
clear all
close all
f_ori=imread('.\Images\100007.jpg');
figure,imshow(f_ori);
[rows,cols,dim]=size(f_ori);
%% parameters computation
f_size=min(size(f_ori,1),size(f_ori,2));
gauF_w=2*ceil(f_size/500)+1;rs=ceil(f_size/500)+1;rm=ceil(f_size/100)+5;
%% gaussian filtering
sigma=1.0;gausFilter=fspecial('gaussian',[gauF_w gauF_w],sigma);g=imfilter(f_ori,gausFilter,'replicate');
%% Actually, you can use SE (2015-PAMI) to obtain better gradient images
F_ori=rgb2lab(f_ori);
a1=sgrad_edge(normalized(F_ori(:,:,1))).^2;b1=sgrad_edge(abs(normalized(F_ori(:,:,2)))).^2;c1=sgrad_edge(normalized(F_ori(:,:,3))).^2;
Gradient=sqrt(a1+b1+c1);
%% AMR-WT, you can find detailed technology and algorithm in TIP-2019
%Please cite the paper "Tao Lei, Xiaohong Jia,Tongliang Liu,Shigang Liu,Hongying Meng,and Asoke K. Nandi,
%Adaptive Morphological Reconstruction for Seeded Image Segmentation,
%IEEE Transactions on Image Processing, vol.28, no.11, pp.5510-5523, Nov. 2019."
Super_L=w_recons_adaptive(Gradient,rs,[rm 0.0001]);
L2=imdilate(Super_L,strel('square',2));
[Lseg,~,Num,centerLab]=Label_image(f_ori,L2);
BW = boundarymask(L2);
Super_line = imoverlay(Lseg,BW,'red');figure,imshow(Super_line);
%% Desnity peaks--2014Science
percent=2;
[Lab2,gamma,rho,delta,cluster_n,icl,Global_C_Lab,Cluster_Number]=w_DPRS_interval(centerLab,Num,percent);
%% Gaussian Mixed Model
[final_Label,center_Lab] =w_super_gmm(L2,centerLab,Num,cluster_n);
fs=Label_image(f_ori,final_Label);
BW = boundarymask(final_Label);
Lseg_line = imoverlay(fs,BW,'red');figure,imshow(Lseg_line);
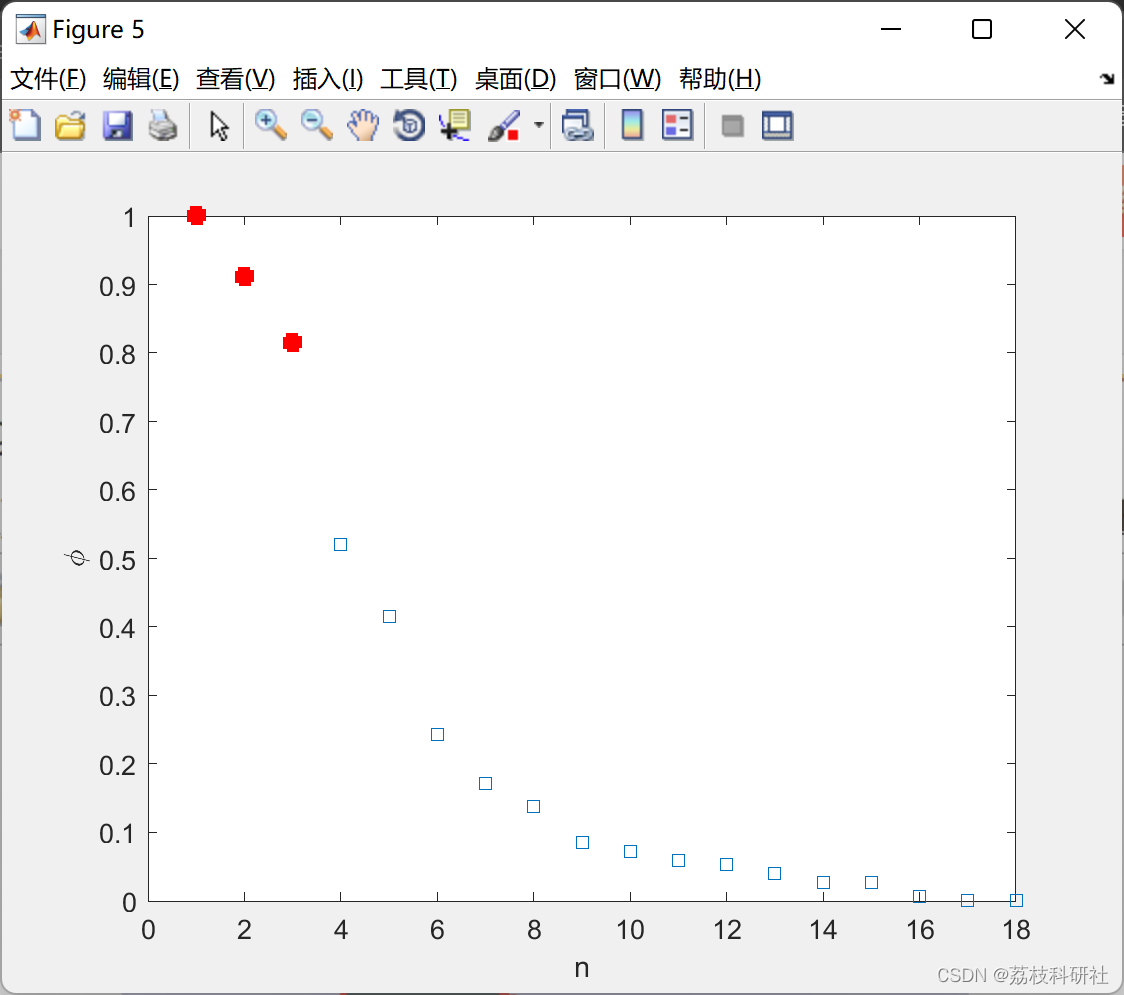
%% drawing figures
figure,plot(gamma,'s')
hold on
plot(gamma(1:cluster_n),'s','MarkerFaceColor','r','Linewidth',2.5,'MarkerEdgeColor','r') % clustering centers are
xlabel ('n');
ylabel ('\phi');
🌈3 Matlab代码实现
🎉4 参考文献
部分理论来源于网络,如有侵权请联系删除。
T. Lei, P. Liu, X. Jia, X. Zhang, H. Meng and A. K. Nandi, "Automatic Fuzzy Clustering Framework for Image Segmentation," in IEEE Transactions on Fuzzy Systems, vol. 28, no. 9, pp. 2078-2092, Sept. 2020, doi: 10.1109/TFUZZ.2019.2930030.


 451
451


 被折叠的 条评论
为什么被折叠?
被折叠的 条评论
为什么被折叠?
 到【灌水乐园】发言


