


> library(survival)
> library(regplot)
> library(rms)
> expFile="expTime.txt"
> cliFile="clinical.txt"
> exp=read.table(expFile, header=T, sep="\t", check.names=F, row.names=1)
> cli=read.table(cliFile, header=T, sep="\t", check.names=F, row.names=1)
> cli=cli[apply(cli,1,function(x)any(is.na(match('unknow',x)))),,drop=F]
> cli$Age=as.numeric(cli$Age)
> samSample=intersect(row.names(exp), row.names(cli))
> exp1=exp[samSample,,drop=F]
> cli=cli[samSample,,drop=F]
> rt=cbind(exp1, cli)
> res.cox=coxph(Surv(futime, fustat) ~ . , data = rt)
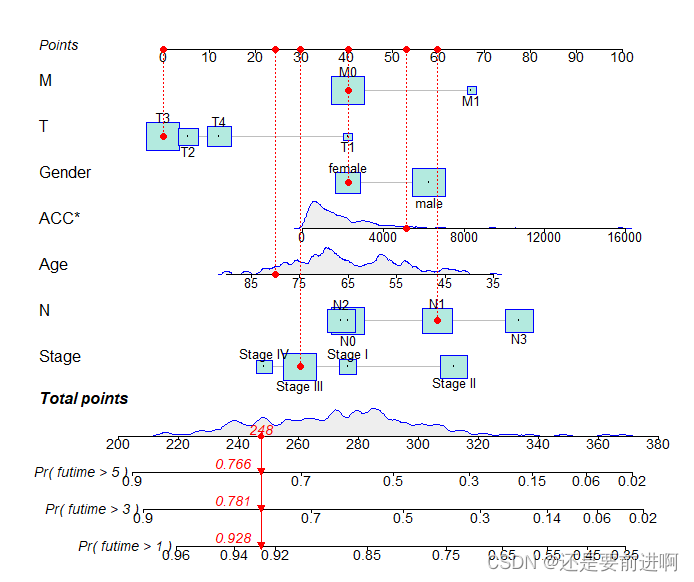
> nom1<-regplot(res.cox,
plots = c("density", "boxes"),
clickable=F,
title="",
points=TRUE,
droplines=TRUE,
observation=rt[2,],
rank="sd",
failtime = c(1,3,5),
prfail = F)
> nomoRisk=predict(res.cox, data=rt, type="risk")
> rt=cbind(exp1, Nomogram=nomoRisk)
> outTab=rbind(ID=colnames(rt), rt)
> write.table(outTab, file="nomoRisk.txt", sep="\t", col.names=F, quote=F)
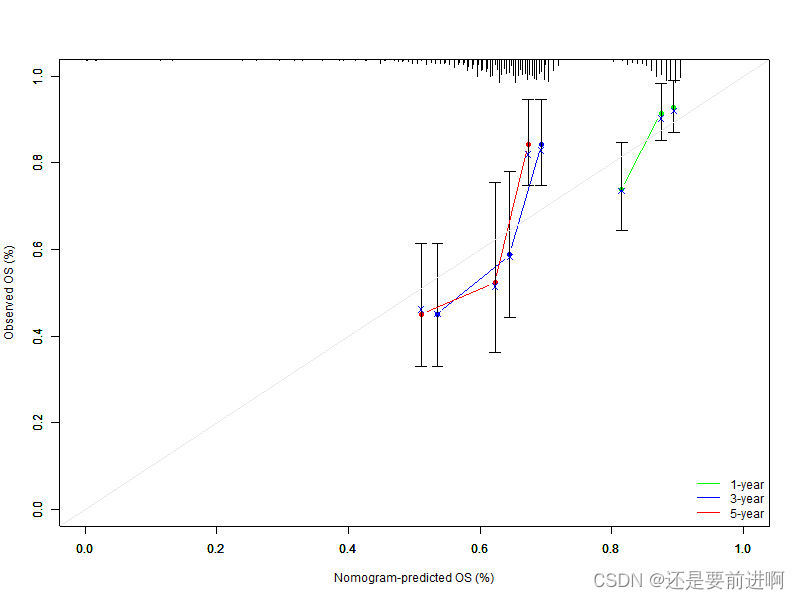
> pdf(file="calibration.pdf", width=5, height=5)
> f <- cph(Surv(futime, fustat) ~ Nomogram, x=T, y=T, surv=T, data=rt, time.inc=1)
> cal <- calibrate(f, cmethod="KM", method="boot", u=1, m=(nrow(rt)/3), B=1000)
> plot(cal, xlim=c(0,1), ylim=c(0,1),
xlab="Nomogram-predicted OS (%)", ylab="Observed OS (%)", lwd=1.5, col="green", sub=F)
> f <- cph(Surv(futime, fustat) ~ Nomogram, x=T, y=T, surv=T, data=rt, time.inc=3)
> cal <- calibrate(f, cmethod="KM", method="boot", u=3, m=(nrow(rt)/3), B=1000)
> plot(cal, xlim=c(0,1), ylim=c(0,1), xlab="", ylab="", lwd=1.5, col="blue", sub=F, add=T)
> f <- cph(Surv(futime, fustat) ~ Nomogram, x=T, y=T, surv=T, data=rt, time.inc=5)
> cal <- calibrate(f, cmethod="KM", method="boot", u=5, m=(nrow(rt)/3), B=1000)
> plot(cal, xlim=c(0,1), ylim=c(0,1), xlab="", ylab="", lwd=1.5, col="red", sub=F, add=T)
legend('bottomright', c('1-year', '3-year', '5-year'),
col=c("green","blue","red"), lwd=1.5, bty = 'n')
> dev.off()
学习交流一下


 2530
2530

 被折叠的 条评论
为什么被折叠?
被折叠的 条评论
为什么被折叠?
 到【灌水乐园】发言


