


如果你有兴趣或计划做与图像或视频相关的事情,你绝对应该考虑使用计算机视觉。计算机视觉 (CV) 是人工智能 (AI) 的一个分支,它使计算机能够从图像、视频和其他视觉输入中提取有意义的信息,并采取必要的行动。例如自动驾驶汽车、自动交通管理、监控、基于图像的质量检查等等。
什么是 OpenCV?
OpenCV 是一个主要针对计算机视觉的库。它拥有你在使用计算机视觉 (CV) 时所需的所有工具。“Open”代表开源,“CV”代表计算机视觉。
我会学到什么?
本文包含使用 OpenCV 库开始使用计算机视觉所需的全部内容。你会在计算机视觉方面感到更加自信和高效。所有代码和数据都在这里:https://www.kaggle.com/sonukiller99/open-cv-for-beginners
读取和显示图像
首先让我们了解如何读取图像并显示它,这是CV的基础知识。
读取图像:
import numpy as np
import cv2 as cv
import matplotlib.pyplot as plt
img=cv2.imread('../input/images-for-computer-vision/tiger1.jpg')
'img' 包含 numpy 数组形式的图像。让我们打印它的类型和形状,
print(type(img))
print(img.shape)
numpy 数组的形状为 (667, 1200, 3),其中,
667 – 图像高度,1200 – 图像宽度,3 – 通道数,
在这种情况下,有 RGB 通道,所以我们有 3 个通道。原始图像是 RGB 的形式,但 OpenCV 默认将图像读取为 BGR,因此我们必须在显示之前将其转换回RGB。
显示图像:
# Converting image from BGR to RGB for displaying
img_convert=cv.cvtColor(img, cv.COLOR_BGR2RGB)
plt.imshow(img_convert)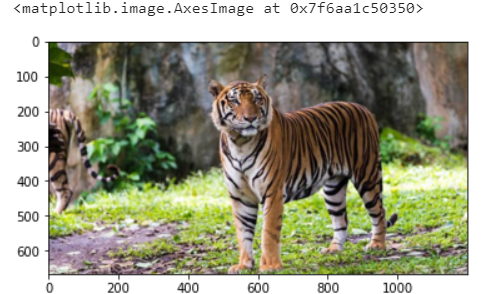
在图像上绘图
我们可以绘制线条、形状和文本图像。
# Rectangle
color=(240,150,240) # Color of the rectangle
cv.rectangle(img, (100,100),(300,300),color,thickness=10, lineType=8) ## For filled rectangle, use thickness = -1
## (100,100) are (x,y) coordinates for the top left point of the rectangle and (300, 300) are (x,y) coordinates for the bottom right point
# Circle
color=(150,260,50)
cv.circle(img, (650,350),100, color,thickness=10) ## For filled circle, use thickness = -1
## (250, 250) are (x,y) coordinates for the center of the circle and 100 is the radius# Text
color=(50,200,100)
font=cv.FONT_HERSHEY_SCRIPT_COMPLEX
cv.putText(img, 'Save Tigers',(200,150), font, 5, color,thickness=5, lineType=20)# Converting BGR to RGB
img_convert=cv.cvtColor(img, cv.COLOR_BGR2RGB)
plt.imshow(img_convert) 最低0.47元/天 解锁文章


 5万+
5万+


 被折叠的 条评论
为什么被折叠?
被折叠的 条评论
为什么被折叠?
 到【灌水乐园】发言


