


嵌入在机器学习无处不在,出现在推荐系统中,NLP,和许多其他应用。事实上,在tensorflow的环境下,很自然的,会将其中的张量(或张量的切片)视为空间中的点,所以几乎任何tensorflow系统自然会产生各种嵌入。
tensorboard有一个内置的可视化工具,称为嵌入投影机,可用来交互式的可视化,也可分析诸如嵌入的高维数据。嵌入投影机将从你的模型检查点文件中读取嵌入。虽然嵌入是最有用的,它会加载任何二维张量,包括你的训练量。
默认情况下,嵌入投影机投影高维数据到3个维度,采用主成分分析。对于PCA的可视化解释,请参见本文。另一个非常有用的投影可以使用T-SNE。我们谈论更多的T-SNE后面的教程。
如果您正在使用一个嵌入,您可能会想附加标签/图像到数据点。你可以通过生成一个包含每一个点的标签的元数据文件(metadata file),或者通过使用Python API配置投影机,或手动构建保存一个projector_config.pbtxt在和你的检查点文件同一目录中。
Setup:
三件事可视化你的嵌入:
1) Setup a 2D tensor that holds your embedding(s).
embedding_var = tf.Variable(....)
2) Periodically save your model variables in a checkpoint in LOG_DIR.
  saver = tf.train.Saver()
saver.save(session, os.path.join(LOG_DIR, "model.ckpt"), step)
3) (Optional) Associate metadata with your embedding.
如果你有任何元数据(标签、图片)你的嵌入相关的,你可以告诉tensorboard它通过直接存储projector_config.pbtxt在log_dir,或使用我们的Python API。
例如,下面的projector_config.ptxt将word_embedding张量与存储在log_dir/ metadata.tsv的元数据关联起来:
embeddings {
  tensor_name: 'word_embedding'
  metadata_path: '$LOG_DIR/metadata.tsv'
}
# Create randomly initialized embedding weights which will be trained.
N = 10000 # Number of items (vocab size).
D = 200 # Dimensionality of the embedding.
embedding_var = tf.Variable(tf.random_normal([N,D]), name='word_embedding')

# Format: tensorflow/contrib/tensorboard/plugins/projector/projector_config.proto
config = projector.ProjectorConfig()

# You can add multiple embeddings. Here we add only one.
embedding = config.embeddings.add()
embedding.tensor_name = embedding_var.name
# Link this tensor to its metadata file (e.g. labels).
embedding.metadata_path = os.path.join(LOG_DIR, 'metadata.tsv')

# Use the same LOG_DIR where you stored your checkpoint.
summary_writer = tf.summary.FileWriter(LOG_DIR)

# The next line writes a projector_config.pbtxt in the LOG_DIR. TensorBoard will
# read this file during startup.
projector.visualize_embeddings(summary_writer, config)
tensorboard --logdir=LOG_DIR
Metadata
通常嵌入有与之相关的元数据(例如标签、图片)。元数据应存放在模型检查点外的一个单独的文件由于元数据并不是模型的可训练参数。格式应该是TSV文件(制表符显示为红色)包含列标题的第一行(以粗体显示)和随后的行包含元数据值: Word\tFrequency
Airplane\t345
Car\t241
...
没有与主数据文件共享的显式密钥;相反,元数据文件中的顺序被假定为与嵌入张量中的顺序相匹配。换句话说,第一行是表头信息和(i + 1)-在元数据文件中的线对应的嵌入张量存放在检查站的第i行。
Note: 注意:如果TSV元数据文件只有一个列,然后我们不指望一个标题行,并且假设每行是嵌入标签。我们有这个例外,因为它与常用的“默认文件格式。
Images
如果你有你的嵌入相关的图片,你需要产生一个单一的图像组成的,每个数据点的小缩略图。这就是所谓的sprite image。The sprite应该有相同数量的行和列的缩略图存储在行第一顺序:第一个数据点放在左上角和最后一个数据点在右下角:
| 0 | 1 | 2 |
| 3 | 4 | 5 |
| 6 | 7 |
Note in the example above that the last row doesn't have to be filled.
Note: We currently support sprites up to 8192px X 8192px.在构建精灵之后,你需要告诉嵌入投影仪在哪里找到它:
embedding.sprite.image_path = PATH_TO_SPRITE_IMAGE
# Specify the width and height of a single thumbnail.
embedding.sprite.single_image_dim.extend([w, h])
Interaction
数据面板在左上角,在这里你可以选择运行,嵌入张量和数据列的颜色和标签点。投影屏上的左下方,你从哪里选择投影类型(如PCA、T-SNE)。右侧的检查面板,可以搜索特定的点并查看最近的邻居列表。Projections
嵌入投影机有三种方法,减少数据集的维数:两个线性和一个非线性。每个方法可以用来创建一二或三维视图。主成分分析一个简单的技术,减少尺寸是主成分分析(PCA)。嵌入投影机计算前10主成分。菜单允许您将这些组件投射到两个或三个任意组合中。PCA是一个线性投影,往往有效地检查全局几何。
T-SNE流行的非线性降维技术T-SNE。嵌入投影机提供了二维和三维的T-SNE观点。布局执行客户端动画算法的每一步。因为T-SNE经常保留一些局部结构,探索当地社区发现集群是有用的。虽然可视化高维数据非常有用,T-SNE地块有时是神秘的或误导的。看到这篇大文章如何使用T-SNE有效。
您还可以根据文本搜索构造专门的线性投影,在空间中寻找有意义的方向。若要定义投影轴,请输入两个搜索字符串或正则表达式。程序计算出的标签匹配这些搜索点的质心,以质心之间的差向量作为投影轴。
Navigation
要探索一个数据集,您可以浏览视图,无论是2D或3D模式,缩放,旋转和平移使用自然点击和拖动手势。单击某个点会使右窗格显示最近邻居的显式文本列表,以及当前点的距离。最近邻点本身突出的投影。放大到集群提供了一些信息,但有时更有助于限制视图的一个子集的点,并执行预测只在这些点。要做到这一点,您可以选择点以多种方式:
点击一个点后,它的最近邻居也被选中。搜索之后,选择与查询匹配的点。启用选择,单击一个点并拖动定义一个选择球。在选择了一组点之后,你可以用右边的检查窗格中的“隔离点”按钮将这些点孤立起来进行进一步的分析。
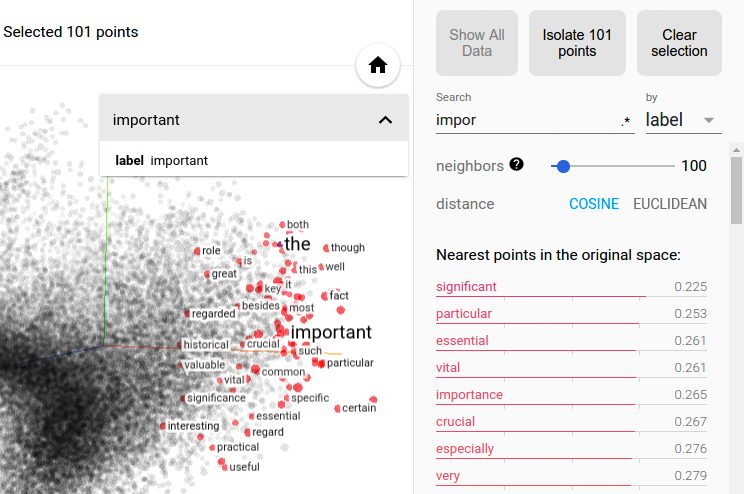 Selection of the nearest neighbors of “important” in a word embedding dataset.
The combination of filtering with custom projection can be powerful. Below, we filtered the 100 nearest neighbors of “politics” and projected them onto the “best” - “worst” vector as an x axis. The y axis is random.
You can see that on the right side we have “ideas”, “science”, “perspective”, “journalism” while on the left we have “crisis”, “violence” and “conflict”.
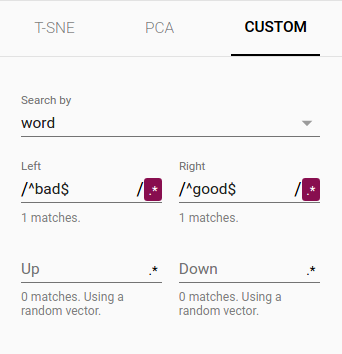 | 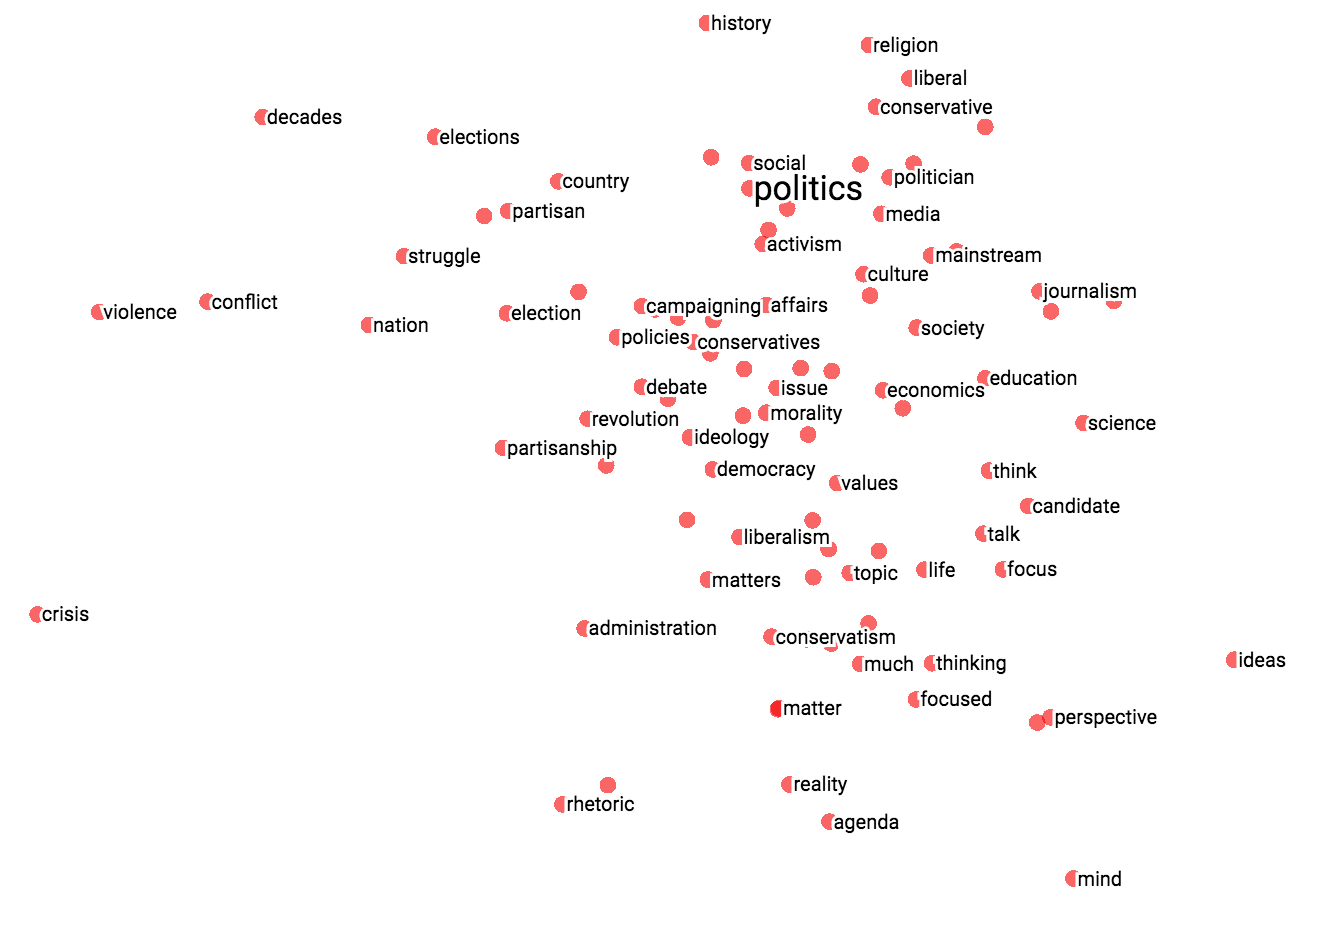 |
| Custom projection controls. | Custom projection of neighbors of "politics" onto "best" - "worst" vector. |
Collaborative Features
为了分享您的发现,您可以使用右下角的书签面板,并保存当前状态(包括任何投影的计算坐标)作为一个小文件。然后,投影机可以指向一组或多个这些文件,产生下面的面板。其他用户可以通过一系列的书签。

Selection of the nearest neighbors of “important” in a word embedding dataset.
The combination of filtering with custom projection can be powerful. Below, we filtered the 100 nearest neighbors of “politics” and projected them onto the “best” - “worst” vector as an x axis. The y axis is random.
You can see that on the right side we have “ideas”, “science”, “perspective”, “journalism” while on the left we have “crisis”, “violence” and “conflict”.
| | |
| Custom projection controls. | Custom projection of neighbors of "politics" onto "best" - "worst" vector. |


 2348
2348


 被折叠的 条评论
为什么被折叠?
被折叠的 条评论
为什么被折叠?
 到【灌水乐园】发言


