# -*- coding: utf-8-*-
"""
Created on Mon May 120:18:452023
https://www.geeksforgeeks.org/displaying-3d-images-in-python/@author: Mr.Yang
"""
# Import libraries
import matplotlib.pyplot as plt
from mpl_toolkits.mplot3d import Axes3D
import numpy as np
# Change the Size of Graph using
# Figsize
fig = plt.figure(figsize=(10,10))
# Generating a 3D sine wave
ax = plt.axes(projection='3d')
# Create axis
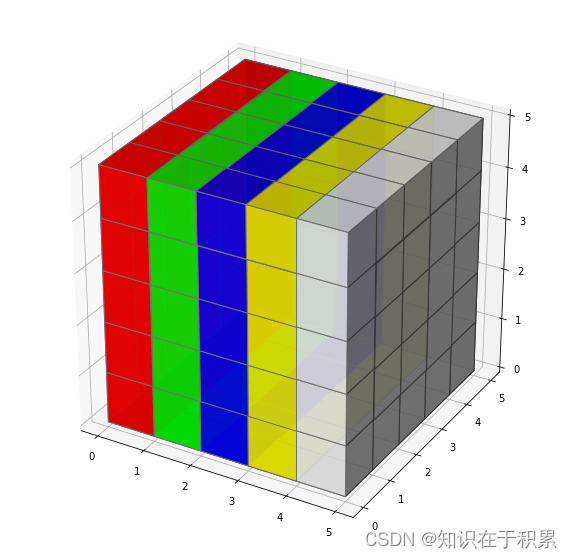
axes =[5,5,5]
# Create Data
data = np.ones(axes)#3D数组
print(data)
# Control Tranperency
alpha =0.9
# Control colour
colors = np.empty(axes +[4])#4D数组
print(colors)
colors[0]=[1,0,0, alpha] # red
colors[1]=[0,1,0, alpha] # green
colors[2]=[0,0,1, alpha] # blue
colors[3]=[1,1,0, alpha] # yellow
colors[4]=[1,1,1, alpha] # grey
# turn off/on axis
plt.axis('on')
# Voxels is used to customizations of
# the sizes, positions and colors.
ax.voxels(data, facecolors=colors, edgecolors='grey')


 249
249


 被折叠的 条评论
为什么被折叠?
被折叠的 条评论
为什么被折叠?
 到【灌水乐园】发言


