


namespace plt=matplotlibcpp
利用vs调用matplotlib绘制直方图、折线图或者显示图片,显示图像时窗口自备放大、保存等功能,灵活方便,不过只能在release下运行
1 .配置简介:
1.下载python3.8,https://www.python.org/downloads/windows/下载时自觉勾选环境变量、pip插件安装(pip用于安装matplotlib)
2.命令行窗口分别输入python --version pip --version 检查安装是否成功,成功会出现对应版本
3.返回命令行窗口,输入命令pip install numpy
pip install matplotlib下载对应库
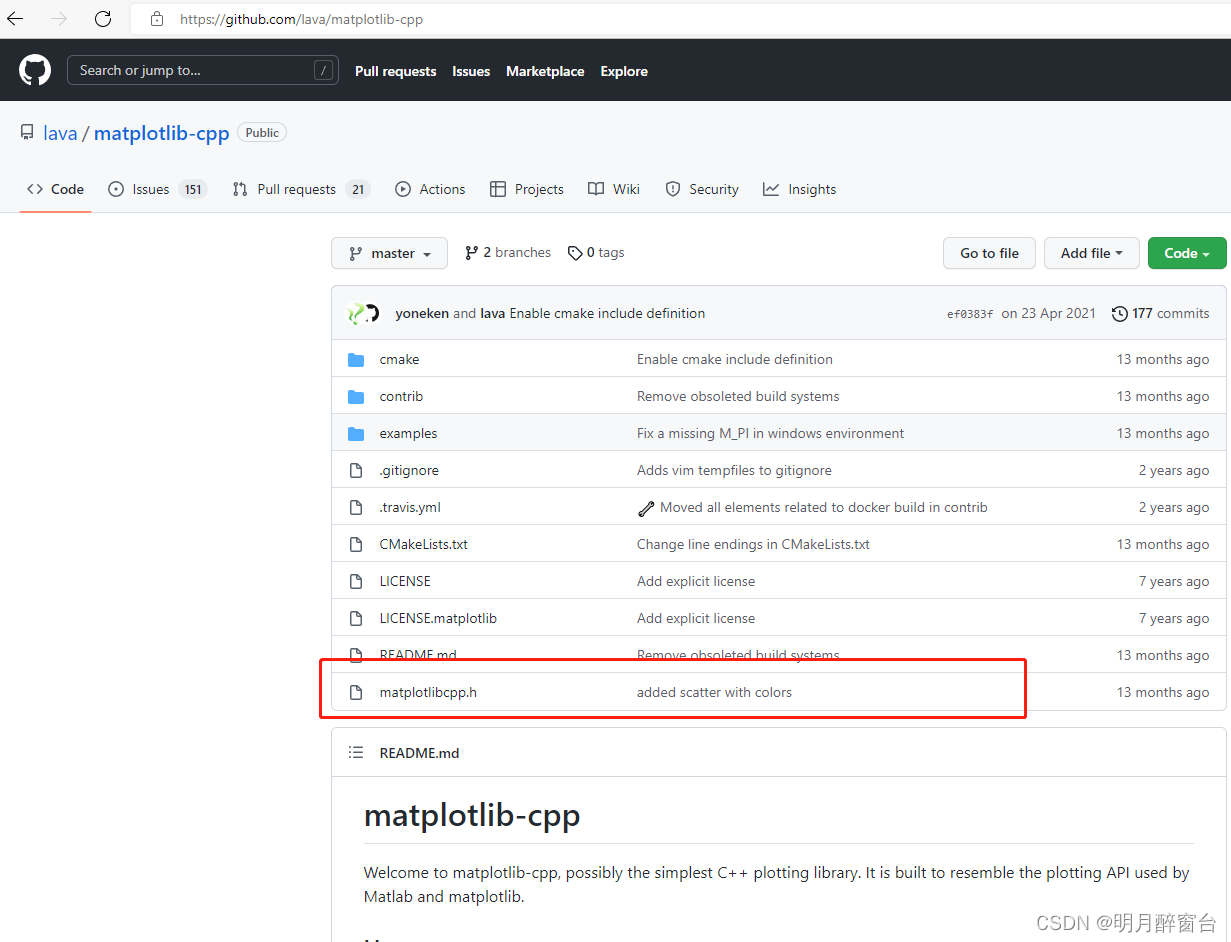
4.下载matplotlib-cpp文件找出头文件:https://github.com/lava/matplotlib-cpp
注;下载时会出现下载失败的问题,这是因为服务器在国外,导致下载速度较慢,可自行百度pip安装镜像源更换,换为清华或者其他公司源
换源操作:
windows:
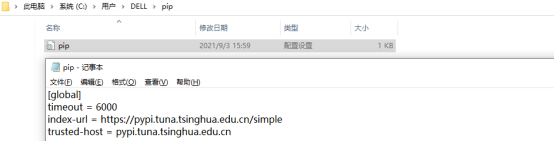
直接在user目录中创建一个pip目录,如:C:\Users\xx\pip,在pip 目录下新建文件pip.ini,内容如下
例如:换为清华源
[global]
timeout = 6000
index-url = https://pypi.tuna.tsinghua.edu.cn/simple
trusted-host = pypi.tuna.tsinghua.edu.cn
其他源:
阿里云 http://mirrors.aliyun.com/pypi/simple/
中国科技大学 https://pypi.mirrors.ustc.edu.cn/simple/
豆瓣(douban) http://pypi.douban.com/simple/
清华大学 https://pypi.tuna.tsinghua.edu.cn/simple/
中国科学技术大学 http://pypi.mirrors.ustc.edu.cn/simple/
换源之后,再次进入命令行窗口利用pip安装matplotlib、numpy等库
安装路径将自动选择python路径下的文件中,安装成功即可
然后,vs配置相关环境
包含目录:

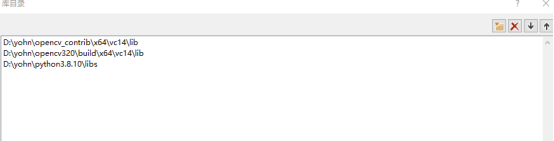
库目录:
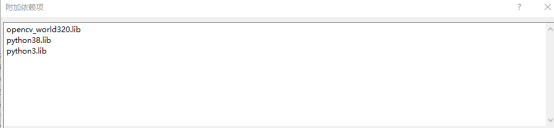
链接器->输入->附加依赖项:
然后可以进行简单测试:必须将matplotlibcpp.h加入工程
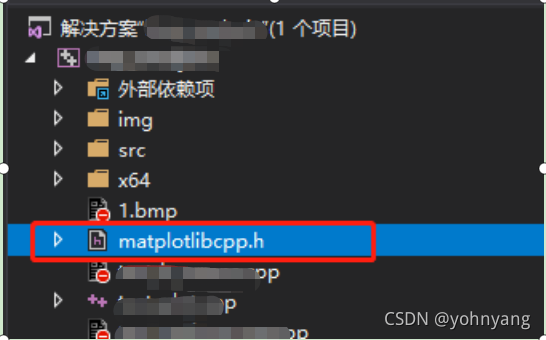
其他可见工程中示例.cpp,下面给出示例:
2.画图:
2.1普通绘图
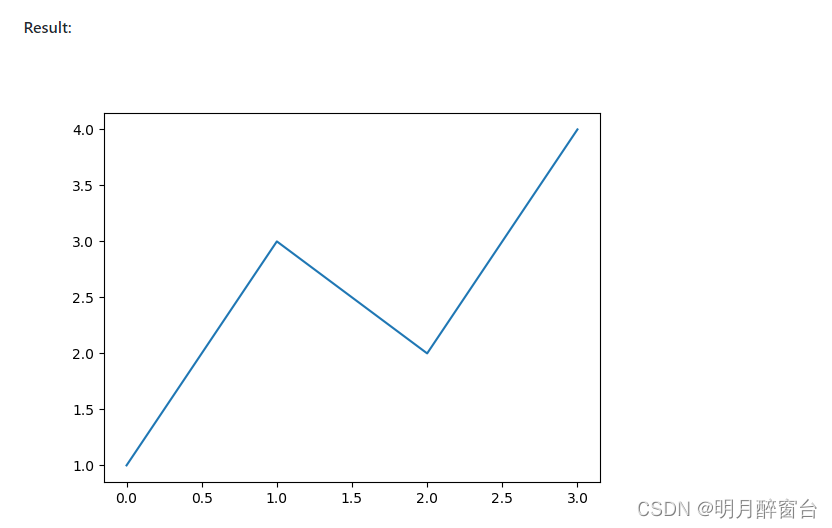
1.折线图:
#include "matplotlibcpp.h"
namespace plt = matplotlibcpp;
int main() {
    plt::plot({1,3,2,4});
    plt::show();
}
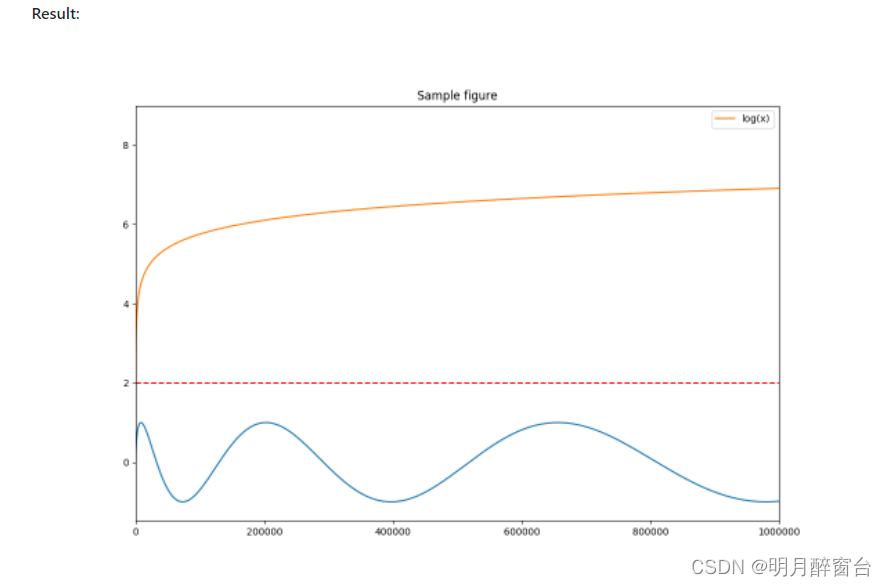
2.曲线图:
#include "matplotlibcpp.h"
#include <cmath>

namespace plt = matplotlibcpp;

int main()
{
    // Prepare data.
    int n = 5000;
    std::vector<double> x(n), y(n), z(n), w(n,2);
    for(int i=0; i<n; ++i) {
        x.at(i) = i*i;
        y.at(i) = sin(2*M_PI*i/360.0);
        z.at(i) = log(i);
    }

    // Set the size of output image to 1200x780 pixels
    plt::figure_size(1200, 780);
    // Plot line from given x and y data. Color is selected automatically.
    plt::plot(x, y);
    // Plot a red dashed line from given x and y data.
    plt::plot(x, w,"r--");
    // Plot a line whose name will show up as "log(x)" in the legend.
    plt::named_plot("log(x)", x, z);
    // Set x-axis to interval [0,1000000]
    plt::xlim(0, 1000*1000);
    // Add graph title
    plt::title("Sample figure");
    // Enable legend.
    plt::legend();
    // Save the image (file format is determined by the extension)
    plt::save("./basic.png");
}
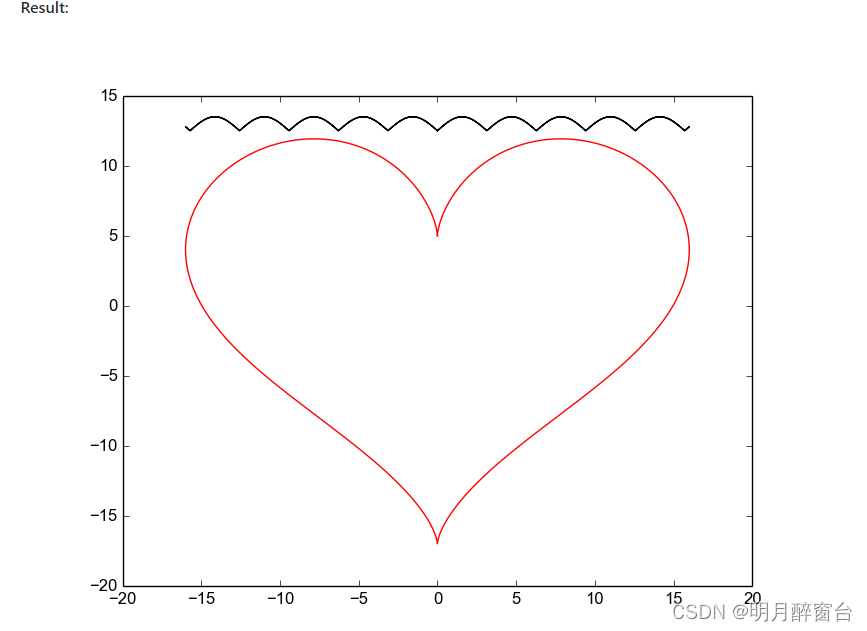
3.闭合曲线:
#include <cmath>
#include "matplotlibcpp.h"

using namespace std;
namespace plt = matplotlibcpp;

int main()
{
    // Prepare data.
    int n = 5000; // number of data points
    vector<double> x(n),y(n);
    for(int i=0; i<n; ++i) {
        double t = 2*M_PI*i/n;
        x.at(i) = 16*sin(t)*sin(t)*sin(t);
        y.at(i) = 13*cos(t) - 5*cos(2*t) - 2*cos(3*t) - cos(4*t);
    }

    // plot() takes an arbitrary number of (x,y,format)-triples.
    // x must be iterable (that is, anything providing begin(x) and end(x)),
    // y must either be callable (providing operator() const) or iterable.
    plt::plot(x, y, "r-", x, [](double d) { return 12.5+abs(sin(d)); }, "k-");


    // show plots
    plt::show();
}
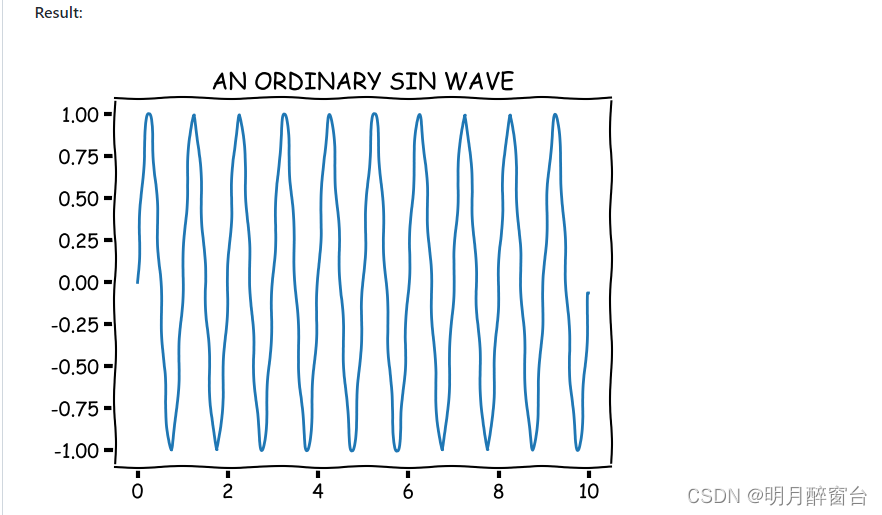
4.波形图:
#include "matplotlibcpp.h"
#include <vector>
#include <cmath>

namespace plt = matplotlibcpp;

int main() {
    std::vector<double> t(1000);
    std::vector<double> x(t.size());

    for(size_t i = 0; i < t.size(); i++) {
        t[i] = i / 100.0;
        x[i] = sin(2.0 * M_PI * 1.0 * t[i]);
    }

    plt::xkcd();
    plt::plot(t, x);
    plt::title("AN ORDINARY SIN WAVE");
    plt::save("xkcd.png");
}
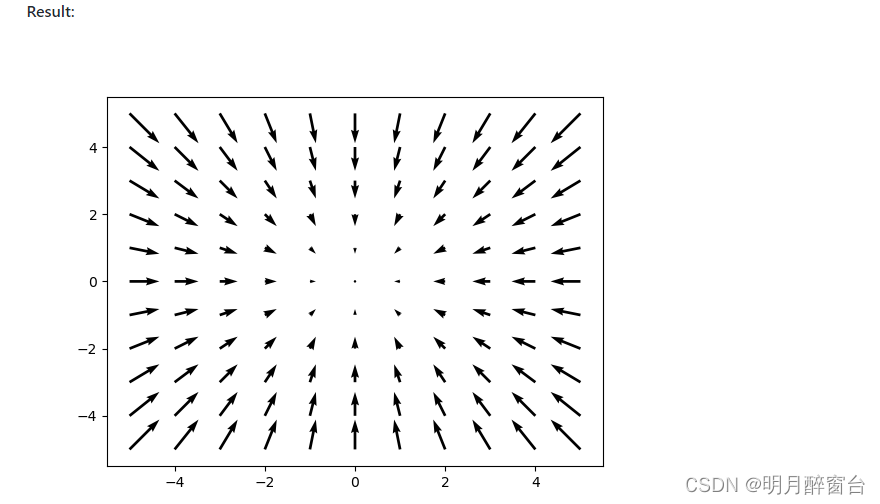
5.箭头图:
#include "../matplotlibcpp.h"
namespace plt = matplotlibcpp;

int main()
{
    // u and v are respectively the x and y components of the arrows we're plotting
    std::vector<int> x, y, u, v;
    for (int i = -5; i <= 5; i++) {
        for (int j = -5; j <= 5; j++) {
            x.push_back(i);
            u.push_back(-i);
            y.push_back(j);
            v.push_back(-j);
        }
    }
    plt::quiver(x, y, u, v);
    plt::show();
}
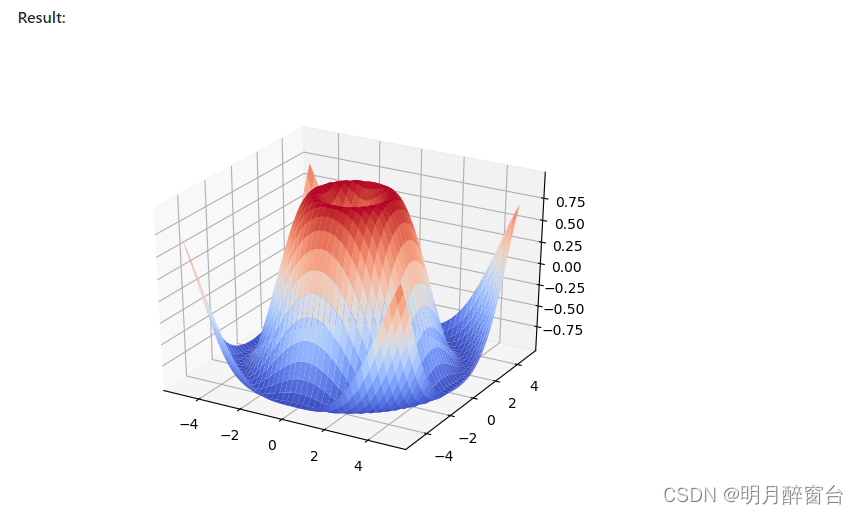
7.曲面图:
#include "../matplotlibcpp.h"
namespace plt = matplotlibcpp;

int main()
{
    std::vector<std::vector<double>> x, y, z;
    for (double i = -5; i <= 5;  i += 0.25) {
        std::vector<double> x_row, y_row, z_row;
        for (double j = -5; j <= 5; j += 0.25) {
            x_row.push_back(i);
            y_row.push_back(j);
            z_row.push_back(::std::sin(::std::hypot(i, j)));
        }
        x.push_back(x_row);
        y.push_back(y_row);
        z.push_back(z_row);
    }

    plt::plot_surface(x, y, z);
    plt::show();
}
2.2.绘制统计直方图
输入数组分组,分组数对应最终画出的直方图小块个数
int bin_width=3;
int num_bins=int((max(a)-min(a))/bin_width)
plt::hist(a,num_bins);//输入数据和组数
//可以传入一个列表,长度为组数,值为分组依据,当组距不均匀的时候使用
//plt::hist(a,[min(a)+i*bin_width for i in range(num_bins)]);

//normed:bool是否绘制频率分布直方图,默认为频数直方图
//plt::hist(a,num_bins,normed=1);


 1万+
1万+


 被折叠的 条评论
为什么被折叠?
被折叠的 条评论
为什么被折叠?
 到【灌水乐园】发言


