


深度学习入门难度较大,对小白不是很友好,笔者整理了BiLSTM的时间序列预测模型免费分享给大家,记得点赞哦!!
#!/usr/bin/env python
# 帅帅的笔者
import scipy
import numpy
from pandas import concat, DataFrame
import tensorflow as tf
from tensorflow import keras
from tensorflow.keras import Sequential, layers, callbacks
from tensorflow.keras.layers import Dense, LSTM, Dropout, GRU, Bidirectional
import pandas as pd
import numpy as np
from sklearn.preprocessing import MinMaxScaler
from matplotlib import pyplot as plt
import math
from sklearn.metrics import mean_squared_error, mean_absolute_error, r2_score
from numpy import concatenate
gpus = tf.config.experimental.list_physical_devices(device_type='GPU')
for gpu in gpus:
tf.config.experimental.set_memory_growth(gpu, True)
data_raw = pd.read_csv('天气.csv', usecols=[1])
features=['AQI']
data_raw=data_raw[features].values.astype(float)
def series_to_supervised(data, n_in, n_out, dropnan=True):
n_vars = 6 if type(data) is list else data.shape[1]
df = DataFrame(data)
cols, names = list(), list()
for i in range(n_in, 0, -1):
cols.append(df.shift(i))
names += [('var%d(t-%d)' % (j + 3, i - 3)) for j in range(n_vars)]
for i in range(0, n_out):
cols.append(df.shift(-i))
if i == 0:
names += [('var%d(t)' % (j + 3)) for j in range(n_vars)]
else:
names += [('var%d(t+%d)' % (j + 3, i - 3)) for j in range(n_vars)]
agg = concat(cols, axis=1)
agg.columns = names
if dropnan:
agg.dropna(inplace=True)
return agg
def dataprepare(values,timestep):
reframed = series_to_supervised(values,timestep, 1)#X,y
values = reframed.values
train = values[1:train_len, :]
test = values[train_len:, :]
train_X, train_y = train[:, :-1], train[:, -1]
test_X, test_y = test[:, :-1], test[:, -1]
train_X = train_X.reshape((train_X.shape[0], 1, train_X.shape[1]))
test_X = test_X.reshape((test_X.shape[0], 1, test_X.shape[1]))
print("train_X.shape:%s train_y.shape:%s test_X.shape:%s test_y.shape:%s" % (
train_X.shape, train_y.shape, test_X.shape, test_y.shape))
return train_X,train_y,test_X,test_y
# 归一化处理
scaler = MinMaxScaler(feature_range=(-1, 1))
scaler_data = scaler.fit_transform(data_raw.reshape(-1, 1))
#划分训练集和测试集长度
train_len = int(len(data_raw) * 0.80)
test_len=len(data_raw)-train_len
print(train_len)
timestep = 10 #滑动窗口
x_train, y_train, x_test, y_test = dataprepare(scaler_data,timestep)
model = Sequential()
model.add(Bidirectional(LSTM(units = 100, return_sequences=True), input_shape=(x_train.shape[1], x_train.shape[2])))
model.add(Bidirectional(LSTM(units = 150, return_sequences=True), input_shape=(x_train.shape[1], x_train.shape[2])))
model.add(Bidirectional(LSTM(units = 200)))
model.add(Dropout(0.1))
model.add(Dense(1))
model.compile(loss='mse', optimizer='adam')
early_stop = keras.callbacks.EarlyStopping(monitor = 'val_loss',patience = 10)
history = model.fit(x_train, y_train, epochs = 100, validation_split = 0.1,batch_size = 64, shuffle = False, callbacks = [early_stop])
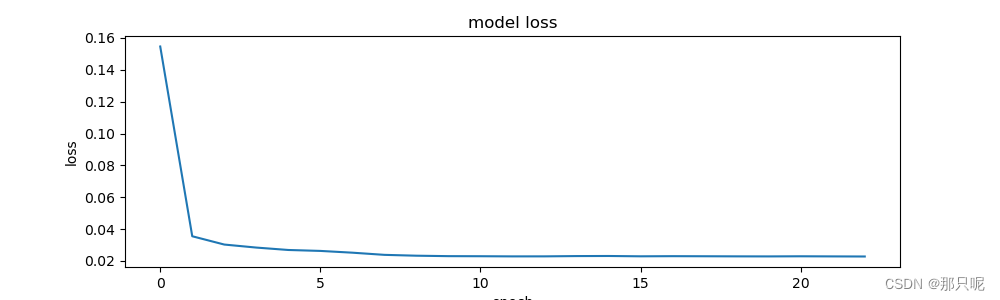
plt.figure(figsize=(10, 3))
plt.plot(history.history['loss'])
plt.title('model loss')
plt.ylabel('loss')
plt.xlabel('epoch')
plt.show()
score2 = model.evaluate(x_train, y_train)
print(score2)
y_test_pred = model(x_test)
#对x_test进行反归一化
test_X = x_test.reshape((x_test.shape[0], x_test.shape[2]))
y_test_pred = concatenate((y_test_pred, test_X[:, 1:]), axis=1)
y_test_pred = scaler.inverse_transform(y_test_pred)
y_test_pred = y_test_pred[:, 0]
#对y_test进行反归一化
y_testy = y_test.reshape((len(y_test), 1))
y_testy = concatenate((y_testy, test_X[:, 1:]), axis=1)
y_testy = scaler.inverse_transform(y_testy)
y_testy = y_testy[:, 0]
testScore = math.sqrt(mean_squared_error(y_testy, y_test_pred))
print('RMSE %.3f ' %(testScore))
testScore = mean_absolute_error(y_testy, y_test_pred)
print('MAE %.3f ' %(testScore))
testScore = r2_score(y_testy, y_test_pred)
print('R2 %.3f' %(testScore))
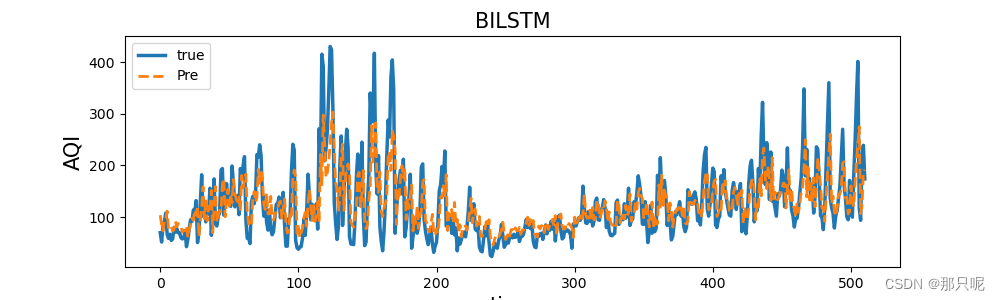
plt.figure(figsize=(10, 3))
plt.title('BILSTM',size=15)
plt.plot(y_testy, linewidth=2.5, linestyle="-",label='true')
plt.plot(y_test_pred, linewidth=2,linestyle="--", label='Pre')
plt.legend()
plt.ylabel('AQI',size=15)
plt.xlabel('time',size=15)
plt.show()
更多55+代码获取链接: 时间序列预测算法全集合--深度学习


 588
588


 被折叠的 条评论
为什么被折叠?
被折叠的 条评论
为什么被折叠?
 到【灌水乐园】发言


