


转载,请保持连接:http://blog.csdn.net/stalendp/article/details/44904639
这篇文章收集关于Matlab的一些代码片段,以便查阅:
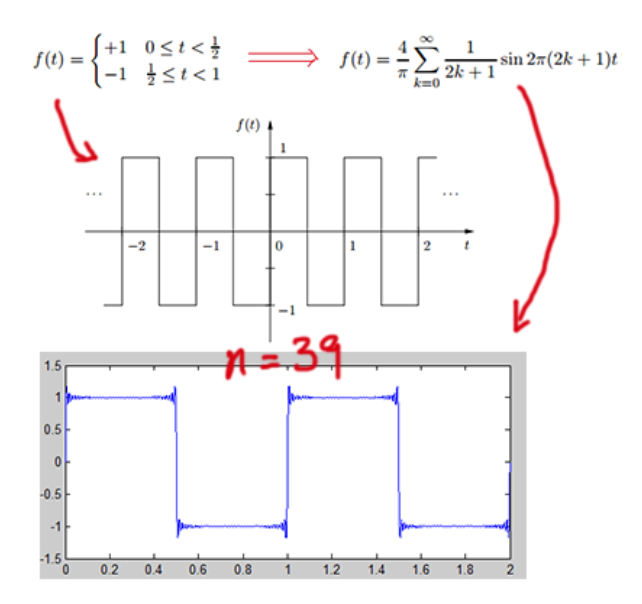
1. 方波
function [] = myFunc(n)
    t = 0:0.001:2;
    y = myFunc0(t, n);
    figure;
    plot(t, y);
end

% 方波
function [ y ] = myFunc0( t, n )
rt = 0;
for k = 0:n
    rt = rt + sin(2*pi*(2*k+1)*t)/(2*k+1);
end
y = rt * 4 / pi;
end
方波图如下:
2. 打印3D曲面
 [x,y] = meshgrid(-8:.1:8);
 z = (2.*x.*y)./(x.*x + y.*y);
mesh(x,y,z);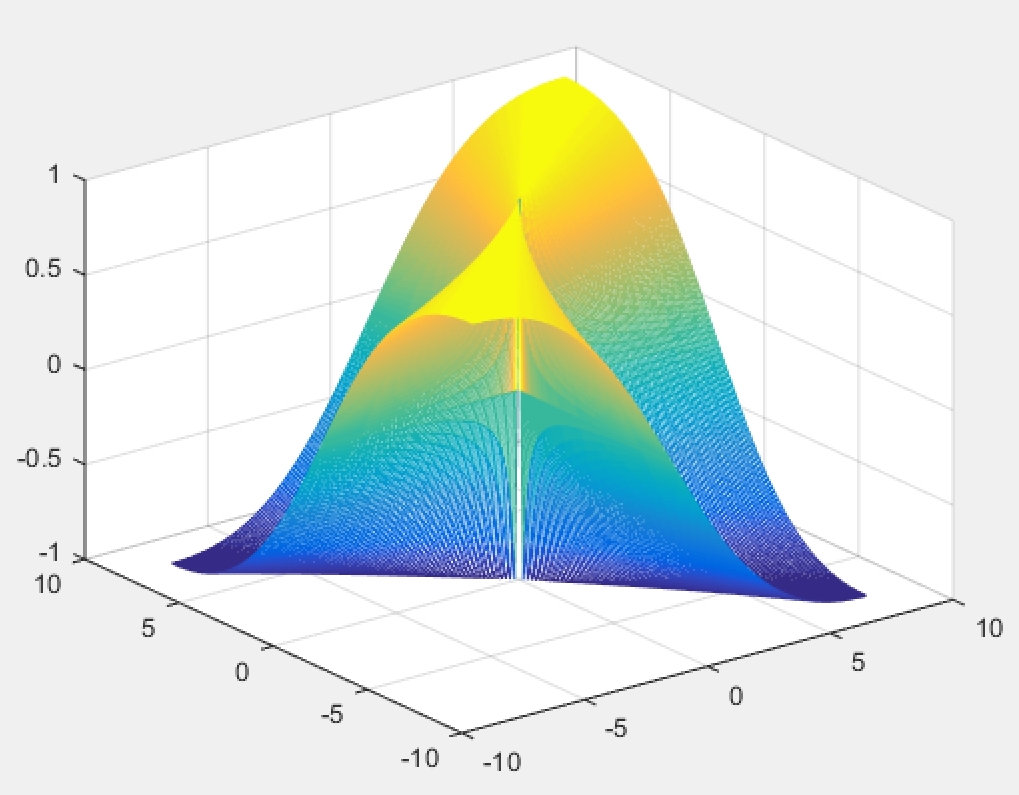
3. 一些打印技巧
% example 1
x = linspace(0,pi);
y = sin(x);
ymax = max(y);
figure(1)
plot(x, y, '-b')
hold on
plot(xlim, [1 1]*ymax, '-r')
hold off
axis([xlim 0 1.1])
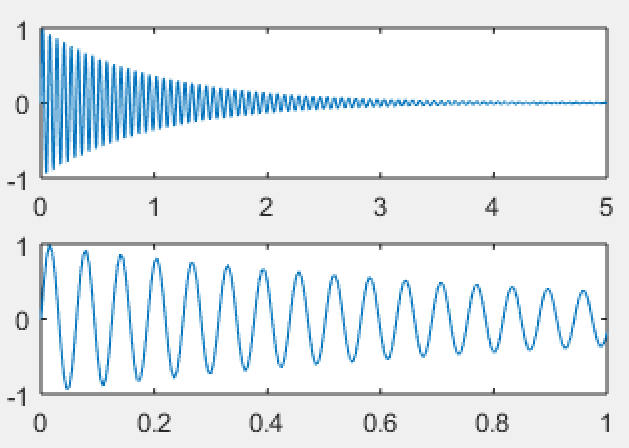
% example 2
x = linspace(0,5,1000);
y = sin(100*x)./exp(x);
ax1 = subplot(2,1,1);
plot(x,y)
ax2 = subplot(2,1,2);
plot(x,y)
xlim(ax2,[0 1])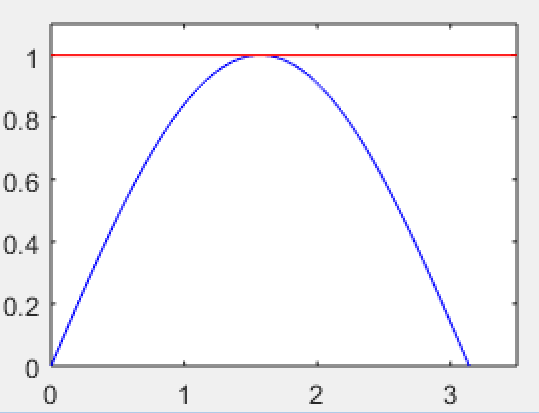
4. 函数的一些使用技巧(function handler, anonymous function);
可以使用matlab中的类来 更好的管理函数模块,请参考5中的方法
function study(n)
    sqr = @(nn) nn.^2;
    C = {@e1, @e2, @e3, @e4, @() sqr(3)};
    C{n}()
end

%相关快捷键:Ctrl+R, Ctrl+T, Ctrl+I %{ %}
function e1
    disp('This is example1');
    figure(1)
    x = linspace(0,pi);
    y = sin(x);
    ymax = max(y);
    plot(x, y, '-b')
    hold on
    plot(xlim, [1 1]*ymax, '-r')
    hold off
    axis([xlim    0  1.1])
end

function e2
    disp('This is example2');
    figure(2)
    x = linspace(0,5,1000);
    y = sin(100*x)./exp(x);
    ax1 = subplot(2,1,1);
    plot(x,y)

    ax2 = subplot(2,1,2);
    plot(x,y)
    xlim(ax2,[0 1])
end

function e3
    disp('This is example3');
    figure(3)
    [x,y] = meshgrid(-8:.1:8);
    z = (2.*x.*y)./(x.*x + y.*y);
    mesh(x,y,z);
end

function e4
    disp('This is example4');
    figure(4)
    myFunc(20);
end
5. 用类的方式来管理函数模块
classdef myclass
    properties
    end

    methods
        function e1(obj)
            disp('This is example1');
            figure(1)
            x = linspace(0,pi);
            y = sin(x);
            ymax = max(y);
            plot(x, y, '-b')
            hold on
            plot(xlim, [1 1]*ymax, '-r')
            hold off
            axis([xlim    0  1.1])
        end

        function e2(obj)
            disp('This is example2');
            figure(2)
            x = linspace(0,5,1000);
            y = sin(100*x)./exp(x);
            ax1 = subplot(2,1,1);
            plot(x,y)
 最低0.47元/天 解锁文章


 5184
5184


 被折叠的 条评论
为什么被折叠?
被折叠的 条评论
为什么被折叠?
 到【灌水乐园】发言


