


 本文介绍了如何在R语言中使用`barplot`函数处理数据框,首先指出`barplot`函数对输入数据的要求,然后展示了如何将数据框转换为矩阵以便进行绘图,以及如何通过转置和调整参数实现不同颜色图例和自定义纵轴范围。
重点
barplot()函数只能使用矩阵或者向量作为数据
as.matrix()#将数据类型转变为矩阵
class()#判断数据类型
t()对矩阵进行转置
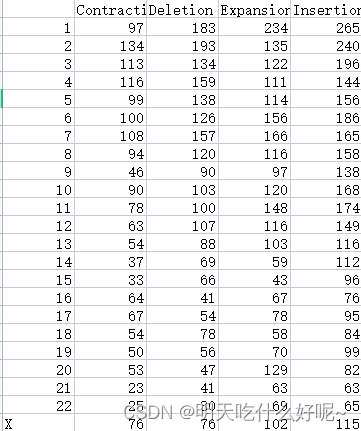
数据概览
代码部分
x <- read.csv(file.choose(),header=T,row.names = 1)#使用sv_distrubution.csv文件,第一列作为行名
barplot(x)#x只能是向量或者矩阵
class(x)#x是数据框
barplot(as.matrix(x))将结果改为矩阵
barplot(t(as.matrix(x)))#对矩阵进行转置
barplot(t(as.matrix(x)),col=rainbow(4),legend.text = colnames(x),ylim=c(0,800)#lengend.text生成图例,ylim确定纵轴范围
#besides=T可以将四个颜色分开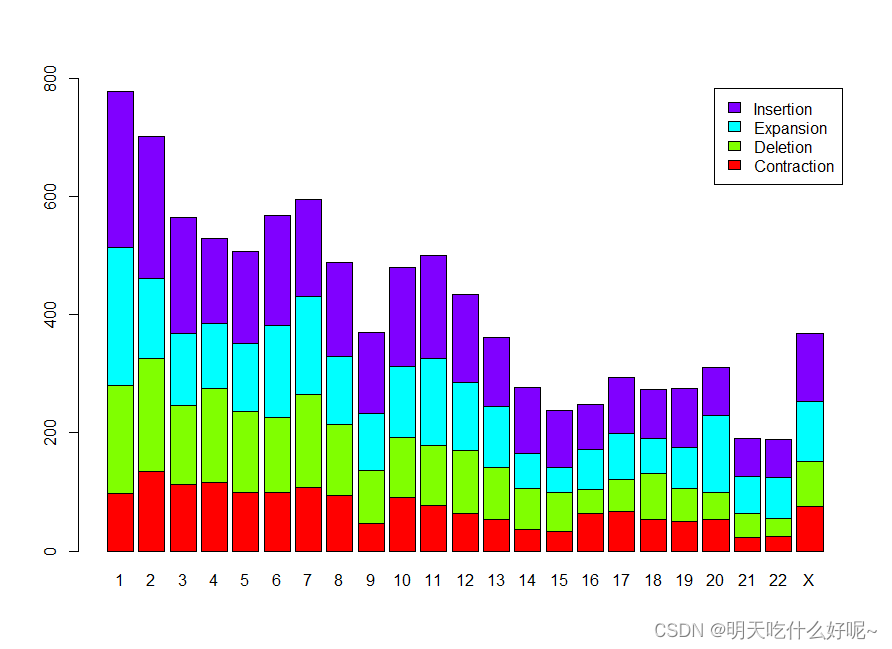


 60
60

 被折叠的 条评论
为什么被折叠?
被折叠的 条评论
为什么被折叠?
 到【灌水乐园】发言


