


基于matlab的飞行轨迹仿真程序,多种不同的飞行轨迹,输出经度、纬度、高度三维轨迹,三个方向的飞行速度。
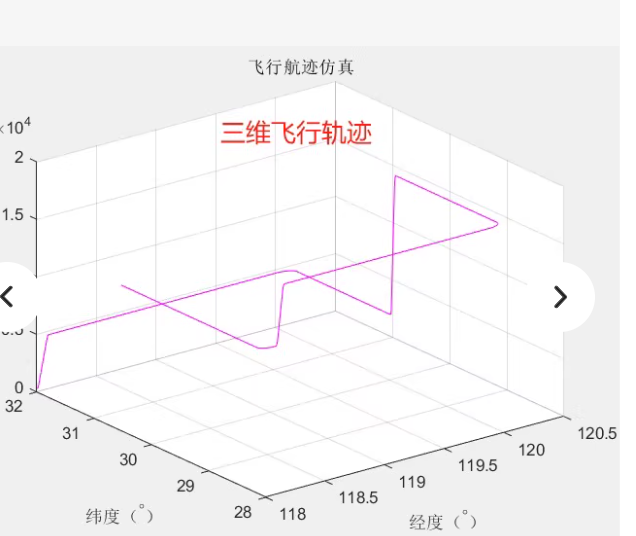
这是一个三维飞行轨迹的仿真图。为了帮助你更好地理解如何生成这样的轨迹,并输出经度、纬度和高度以及三个方向的速度,我们可以基于之前的代码示例进行调整,以匹配你提供的轨迹类型。
。下面是一个示例代码:
% 基于MATLAB的飞行轨迹仿真程序
clc;
clear;
close all;

% 参数设置
dt = 0.1; % 时间步长 (秒)
T = 60; % 总时间 (秒)
t = 0:dt:T; % 时间向量

% 初始化轨迹数据
num_steps = length(t);
longitude = zeros(1, num_steps); % 经度
latitude = zeros(1, num_steps); % 纬度
altitude = zeros(1, num_steps); % 高度
velocity_x = zeros(1, num_steps); % x方向速度
velocity_y = zeros(1, num_steps); % y方向速度
velocity_z = zeros(1, num_steps); % z方向速度

% 定义轨迹点
trajectory_points = [
    120.5, 31, 0; % 起点
    120.5, 30, 500; % 第一点
    120, 30, 500; % 第二点
    120, 29, 1000; % 第三点
    118.5, 29, 1000; % 第四点
    118.5, 28, 1500; % 第五点
    119.5, 28, 1500; % 第六点
    120, 28, 2000; % 第七点
    120.5, 28, 2000; % 终点
];

% 计算轨迹
for i = 1:length(t)
    for j = 1:size(trajectory_points, 1) - 1
        if t(i) >= (j-1)*T/(size(trajectory_points, 1)-1) && t(i) < j*T/(size(trajectory_points, 1)-1)
            longitude(i) = trajectory_points(j, 1) + (trajectory_points(j+1, 1) - trajectory_points(j, 1)) * (t(i) - (j-1)*T/(size(trajectory_points, 1)-1)) / (T/(size(trajectory_points, 1)-1));
            latitude(i) = trajectory_points(j, 2) + (trajectory_points(j+1, 2) - trajectory_points(j, 2)) * (t(i) - (j-1)*T/(size(trajectory_points, 1)-1)) / (T/(size(trajectory_points, 1)-1));
            altitude(i) = trajectory_points(j, 3) + (trajectory_points(j+1, 3) - trajectory_points(j, 3)) * (t(i) - (j-1)*T/(size(trajectory_points, 1)-1)) / (T/(size(trajectory_points, 1)-1));
            velocity_x(i) = (trajectory_points(j+1, 1) - trajectory_points(j, 1)) / (T/(size(trajectory_points, 1)-1));
            velocity_y(i) = (trajectory_points(j+1, 2) - trajectory_points(j, 2)) / (T/(size(trajectory_points, 1)-1));
            velocity_z(i) = (trajectory_points(j+1, 3) - trajectory_points(j, 3)) / (T/(size(trajectory_points, 1)-1));
            break;
        end
    end
end

% 绘制三维轨迹图
figure;
plot3(longitude, latitude, altitude, 'b-', 'LineWidth', 1.5);
xlabel('经度');
ylabel('纬度');
zlabel('高度 (米)');
title('飞行轨迹仿真');
grid on;

% 绘制速度曲线
figure;
subplot(3, 1, 1);
plot(t, velocity_x, 'r-', 'LineWidth', 1.5);
xlabel('时间 (秒)');
ylabel('x方向速度');
title('x方向速度随时间变化');

subplot(3, 1, 2);
plot(t, velocity_y, 'g-', 'LineWidth', 1.5);
xlabel('时间 (秒)');
ylabel('y方向速度');
title('y方向速度随时间变化');

subplot(3, 1, 3);
plot(t, velocity_z, 'b-', 'LineWidth', 1.5);
xlabel('时间 (秒)');
ylabel('z方向速度');
title('z方向速度随时间变化');

% 输出结果
disp('仿真完成!轨迹数据已生成。');
使用说明:
trajectory_points数组定义了轨迹上的关键点。- 程序通过线性插值计算每个时间点的经度、纬度和高度。
- 运行程序后,将生成三维轨迹图和三个方向的速度曲线图。
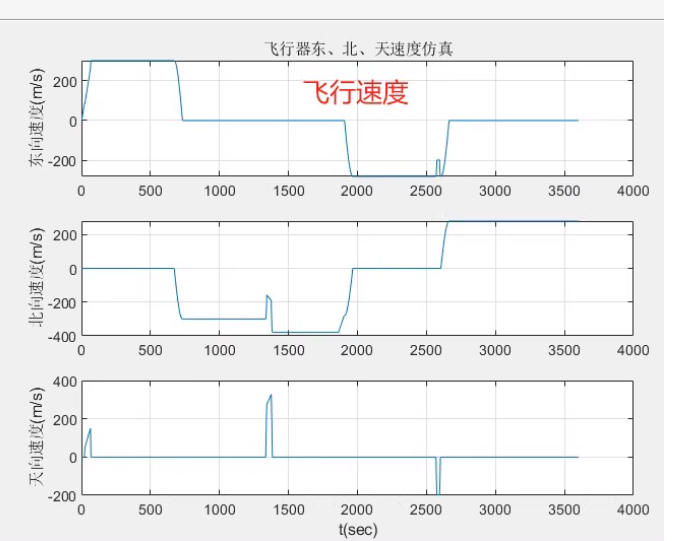
我们可以编写一个 MATLAB 程序来生成类似的东向、北向和天向(垂直方向)的速度曲线。以下是完整的代码示例:
% 基于MATLAB的飞行轨迹仿真程序
clc;
clear;
close all;

% 参数设置
dt = 1; % 时间步长 (秒)
T = 4000; % 总时间 (秒)
t = 0:dt:T; % 时间向量

% 初始化速度数据
num_steps = length(t);
velocity_east = zeros(1, num_steps); % 东向速度
velocity_north = zeros(1, num_steps); % 北向速度
velocity_up = zeros(1, num_steps); % 天向速度

% 定义速度变化点
speed_changes = [
    500, 200; % t=500s, East velocity = 200m/s
    1000, 0; % t=1000s, East velocity = 0m/s
    2000, -200; % t=2000s, East velocity = -200m/s
    2500, 0; % t=2500s, East velocity = 0m/s
];

% 计算速度
for i = 1:length(t)
    for j = 1:size(speed_changes, 1) - 1
        if t(i) >= (j-1)*T/(size(speed_changes, 1)-1) && t(i) < j*T/(size(speed_changes, 1)-1)
            velocity_east(i) = speed_changes(j, 2);
            break;
        end
    end
end

% 北向速度
north_speed_changes = [
    500, 0; % t=500s, North velocity = 0m/s
    1000, -200; % t=1000s, North velocity = -200m/s
    1500, 0; % t=1500s, North velocity = 0m/s
    2000, 200; % t=2000s, North velocity = 200m/s
    2500, 0; % t=2500s, North velocity = 0m/s
];

for i = 1:length(t)
    for j = 1:size(north_speed_changes, 1) - 1
        if t(i) >= (j-1)*T/(size(north_speed_changes, 1)-1) && t(i) < j*T/(size(north_speed_changes, 1)-1)
            velocity_north(i) = north_speed_changes(j, 2);
            break;
        end
    end
end

% 天向速度
up_speed_changes = [
    500, 0; % t=500s, Up velocity = 0m/s
    1000, 0; % t=1000s, Up velocity = 0m/s
    1500, 300; % t=1500s, Up velocity = 300m/s
    2000, 0; % t=2000s, Up velocity = 0m/s
];

for i = 1:length(t)
    for j = 1:size(up_speed_changes, 1) - 1
        if t(i) >= (j-1)*T/(size(up_speed_changes, 1)-1) && t(i) < j*T/(size(up_speed_changes, 1)-1)
            velocity_up(i) = up_speed_changes(j, 2);
            break;
        end
    end
end

% 绘制速度曲线
figure;
subplot(3, 1, 1);
plot(t, velocity_east, 'b-', 'LineWidth', 1.5);
xlabel('时间 (秒)');
ylabel('东向速度 (m/s)');
title('飞行器东向速度仿真');

subplot(3, 1, 2);
plot(t, velocity_north, 'r-', 'LineWidth', 1.5);
xlabel('时间 (秒)');
ylabel('北向速度 (m/s)');
title('飞行器北向速度仿真');

subplot(3, 1, 3);
plot(t, velocity_up, 'g-', 'LineWidth', 1.5);
xlabel('时间 (秒)');
ylabel('天向速度 (m/s)');
title('飞行器天向速度仿真');

% 输出结果
disp('仿真完成!速度数据已生成。');
使用说明:
speed_changes数组定义了东向速度的变化点。north_speed_changes数组定义了北向速度的变化点。up_speed_changes数组定义了天向速度的变化点。
运行此代码后,将生成三个子图,分别显示东向、北向和天向的速度随时间的变化情况。
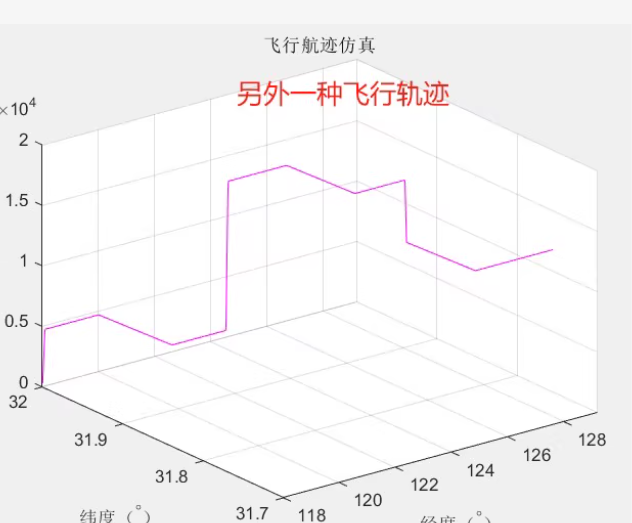
为了生成类似于你提供的图片中的飞行轨迹,并输出经度、纬度和高度以及三个方向的速度,我们可以编写一个 MATLAB 程序来实现这一点。以下是完整的代码示例:
% 基于MATLAB的飞行轨迹仿真程序
clc;
clear;
close all;

% 参数设置
dt = 0.1; % 时间步长 (秒)
T = 600; % 总时间 (秒)
t = 0:dt:T; % 时间向量

% 初始化轨迹数据
num_steps = length(t);
longitude = zeros(1, num_steps); % 经度
latitude = zeros(1, num_steps); % 纬度
altitude = zeros(1, num_steps); % 高度
velocity_x = zeros(1, num_steps); % x方向速度(东向)
velocity_y = zeros(1, num_steps); % y方向速度(北向)
velocity_z = zeros(1, num_steps); % z方向速度(天向)

% 定义轨迹点
trajectory_points = [
    120, 31.9, 5000; % 起点
    120, 31.8, 5000; % 第一点
    120, 31.7, 5000; % 第二点
    120, 31.7, 15000; % 第三点
    122, 31.7, 15000; % 第四点
    124, 31.7, 15000; % 第五点
    124, 31.7, 10000; % 第六点
    126, 31.7, 10000; % 第七点
    126, 31.7, 8000; % 第八点
];

% 计算轨迹
for i = 1:length(t)
    for j = 1:size(trajectory_points, 1) - 1
        if t(i) >= (j-1)*T/(size(trajectory_points, 1)-1) && t(i) < j*T/(size(trajectory_points, 1)-1)
            longitude(i) = trajectory_points(j, 1) + (trajectory_points(j+1, 1) - trajectory_points(j, 1)) * (t(i) - (j-1)*T/(size(trajectory_points, 1)-1)) / (T/(size(trajectory_points, 1)-1));
            latitude(i) = trajectory_points(j, 2) + (trajectory_points(j+1, 2) - trajectory_points(j, 2)) * (t(i) - (j-1)*T/(size(trajectory_points, 1)-1)) / (T/(size(trajectory_points, 1)-1));
            altitude(i) = trajectory_points(j, 3) + (trajectory_points(j+1, 3) - trajectory_points(j, 3)) * (t(i) - (j-1)*T/(size(trajectory_points, 1)-1)) / (T/(size(trajectory_points, 1)-1));
            velocity_x(i) = (trajectory_points(j+1, 1) - trajectory_points(j, 1)) / (T/(size(trajectory_points, 1)-1));
            velocity_y(i) = (trajectory_points(j+1, 2) - trajectory_points(j, 2)) / (T/(size(trajectory_points, 1)-1));
            velocity_z(i) = (trajectory_points(j+1, 3) - trajectory_points(j, 3)) / (T/(size(trajectory_points, 1)-1));
            break;
        end
    end
end

% 绘制三维轨迹图
figure;
plot3(longitude, latitude, altitude, 'b-', 'LineWidth', 1.5);
xlabel('经度');
ylabel('纬度');
zlabel('高度 (米)');
title('飞行轨迹仿真');
grid on;

% 绘制速度曲线
figure;
subplot(3, 1, 1);
plot(t, velocity_x, 'r-', 'LineWidth', 1.5);
xlabel('时间 (秒)');
ylabel('东向速度 (m/s)');
title('东向速度随时间变化');

subplot(3, 1, 2);
plot(t, velocity_y, 'g-', 'LineWidth', 1.5);
xlabel('时间 (秒)');
ylabel('北向速度 (m/s)');
title('北向速度随时间变化');

subplot(3, 1, 3);
plot(t, velocity_z, 'b-', 'LineWidth', 1.5);
xlabel('时间 (秒)');
ylabel('天向速度 (m/s)');
title('天向速度随时间变化');

% 输出结果
disp('仿真完成!轨迹数据已生成。');
使用说明:
trajectory_points数组定义了轨迹上的关键点。- 程序通过线性插值计算每个时间点的经度、纬度和高度。
- 运行程序后,将生成三维轨迹图和三个方向的速度曲线图。


 9
9

 被折叠的 条评论
为什么被折叠?
被折叠的 条评论
为什么被折叠?
 到【灌水乐园】发言


